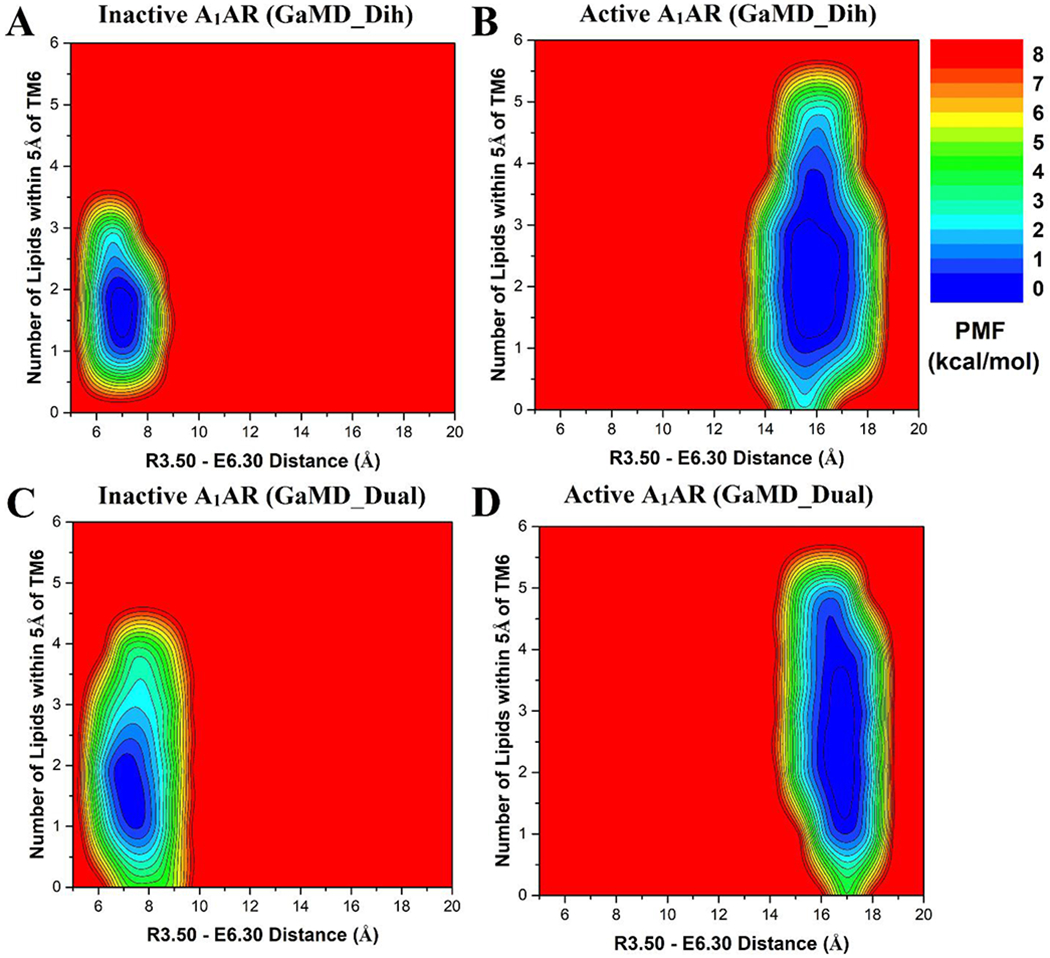
Figure 4:

Free energy profiles of the cytoplasmic lower leaflet of membrane in different simulation systems regarding the number of lipids within 5 Å of the receptor TM6 and the receptor R3.50 – E6.30 distance: (A) Inactive A1AR using dihedral-boost GaMD, (B) Active A1AR using dihedral-boost GaMD, (C) Inactive A1AR using dual-boost GaMD and (D) Active A1AR using dual-boost GaMD. The R3.50 – E6.30 distance is ~7 Å in the inactive A1AR and increases to ~17 Å in the active A1AR due to outward movement of TM6.
