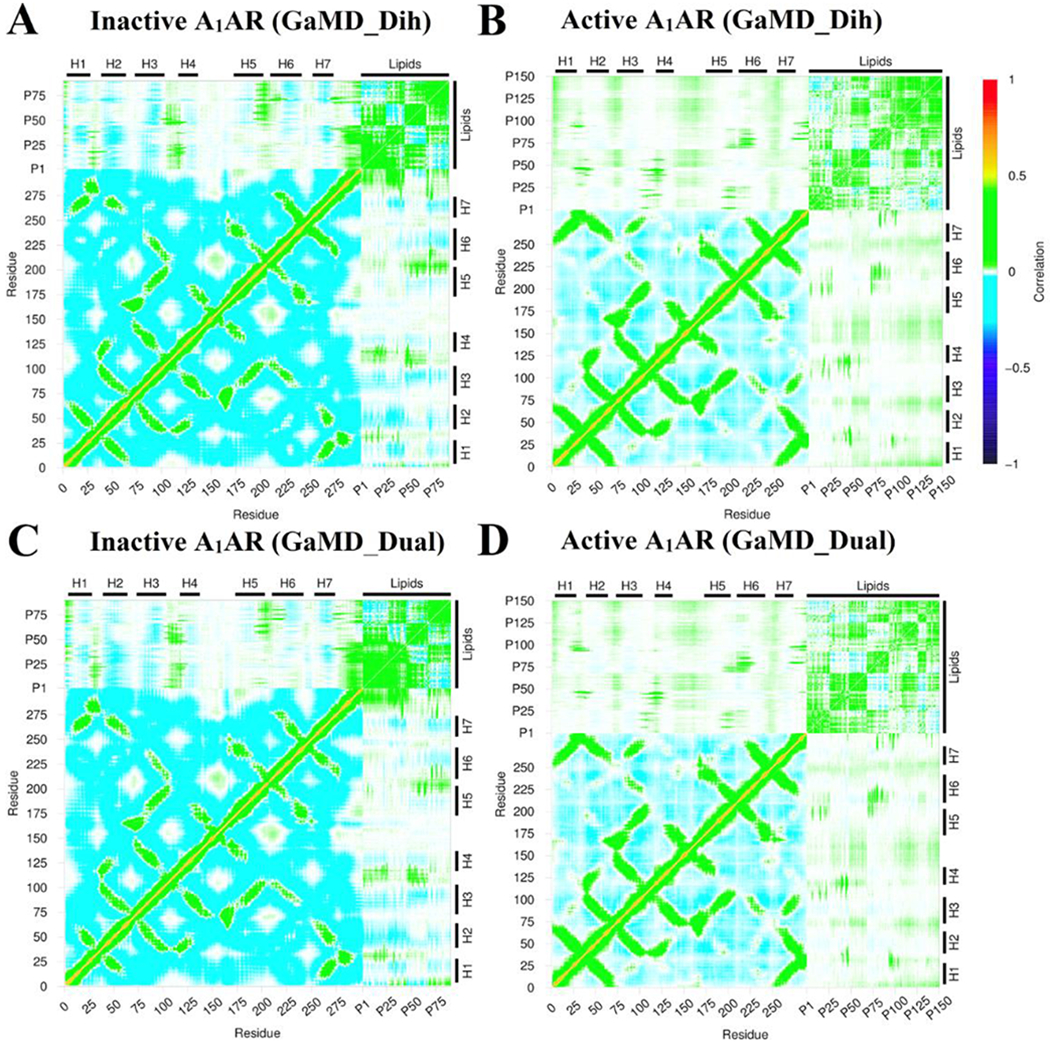
Figure 7:

Dynamic correlation matrices calculated for lipids in the intracellular lower leaflet with residues in the A1AR in different simulation systems: (A) Inactive A1AR using dihedral-boost GaMD, (B) Active A1AR using dihedral-boost GaMD, (C) Inactive A1AR using dual-boost GaMD and (D) Active A1AR using dual-boost GaMD. The Cα atoms of the receptor and phosphorous atoms in the lipid head groups were used for calculating the correlation matrices here. Similar results were obtained using the C8 and C18 atoms in the lipid hydrophobic tails as shown in Figure S5. The receptor ICL1, ICL2 and ICL3 represent intracellular loops between TM helices 1-2, 3-4, and 5-6 respectively. Similarly, the receptor ECL1, ECL2 and ECL3 represent extracellular loops between TM helices 2-3, 4-5, and 6-7 respectively.
