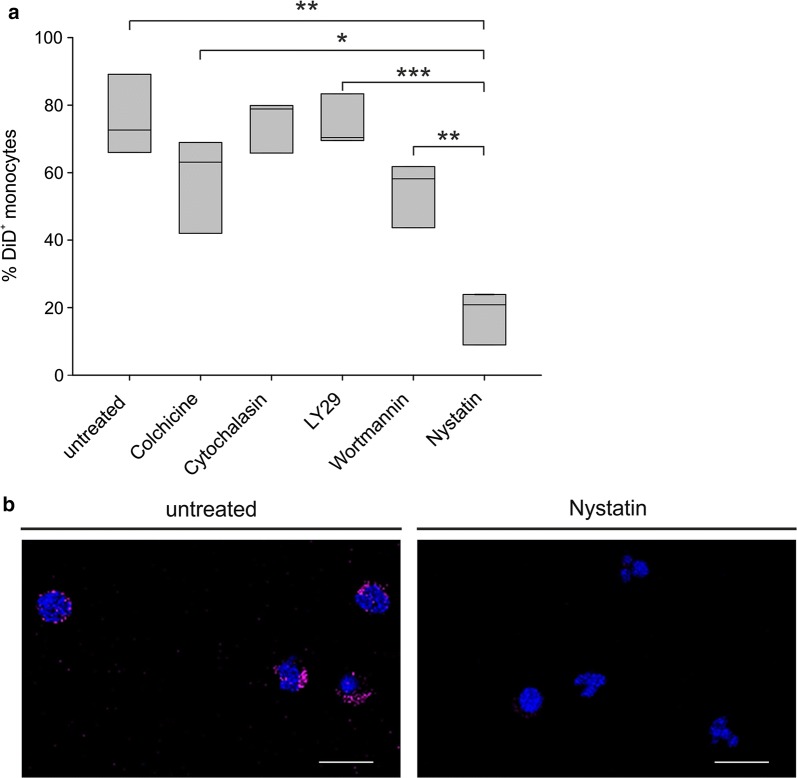
Fig. 4.
Effect of different inhibitors on LNC uptake by circulating monocytes. a PBLs from 3 GBM patients were incubated for 2 h with 100 µg/ml colchicine or 10 µg/ml cytochalasin B, 45′ with 50 µM LY294002, 30′ with 100 nM Wortmannin, 15′ with 100 U/ml Nystatin. DiD-loaded LNCs were added to PBLs at 50 ng/ml DiD for 3 h and then stained for cytometry analysis. Box plots show the range of DiD+ cells in the subsets analyzed in 3 experiments. Student t-test was performed, *P ≤ 0.05; **P ≤ 0.01; ***P ≤ 0.001. b Representative images of confocal analysis of PBMCs from 3 GBM patients incubated with Nystatin and DiD-loaded LNCs at 50 ng/ml DiD for 3 h. Cells were stained with DAPI, and slides were analyzed at a 63× magnification. Cell size is reported by scale bar (10 µm)

