Fig. 5.
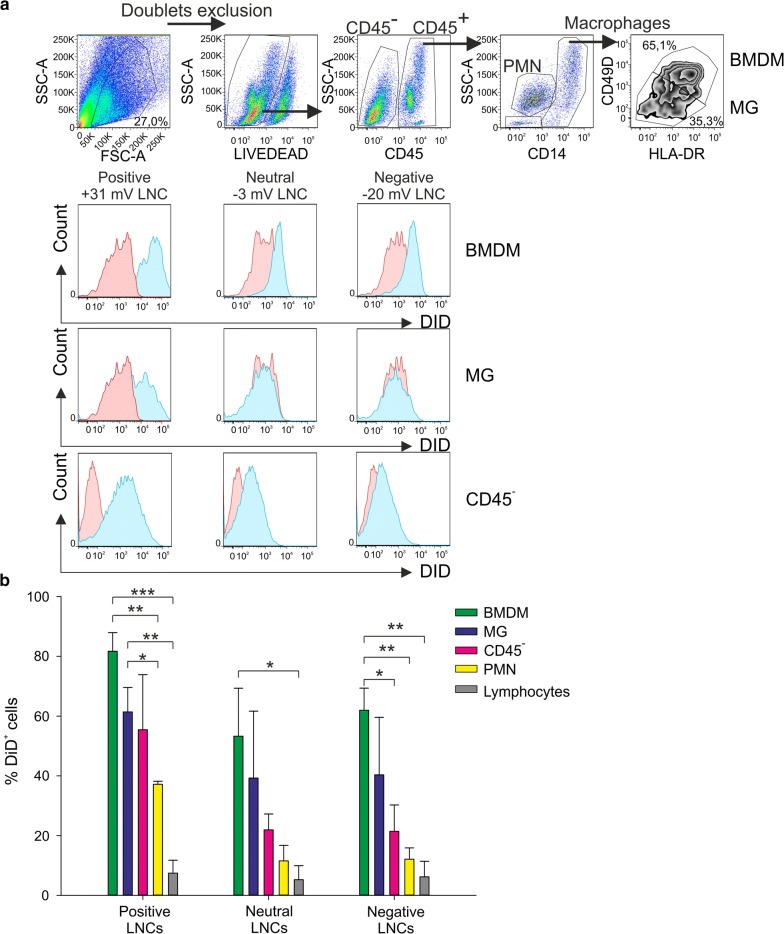
Uptake of differently charged LNCs by the cells in GBM microenvironment. a Representative example of flow cytometry analysis on cell suspension from GBM tissue incubated overnight with 100 nm negative, neutral and positive DiD-LNC formulations at 50 ng/ml DiD concentration. The gating strategy is reported in the upper panels. DiD+ cells (blue histograms) were assessed among BMDM, MG, CD45− cells and compared to the signal of Blank-LNCs (red histogram) among the same populations. b The histograms show mean ± SE of 3 independent experiments, performed as described in (A). The percentage of DiD+ cells was calculated in BMDM (green), MG (blue), CD45− cells (pink), PMN (yellow), and lymphocytes (grey), setting the gate on Blank-LNC control. PMNs were gated as CD14− SSChigh cells and lymphocytes as CD14− SSClow cells. Student t-test was performed, *P ≤ 0.05; **P ≤ 0.01; ***P ≤ 0.001

