Fig. 2.

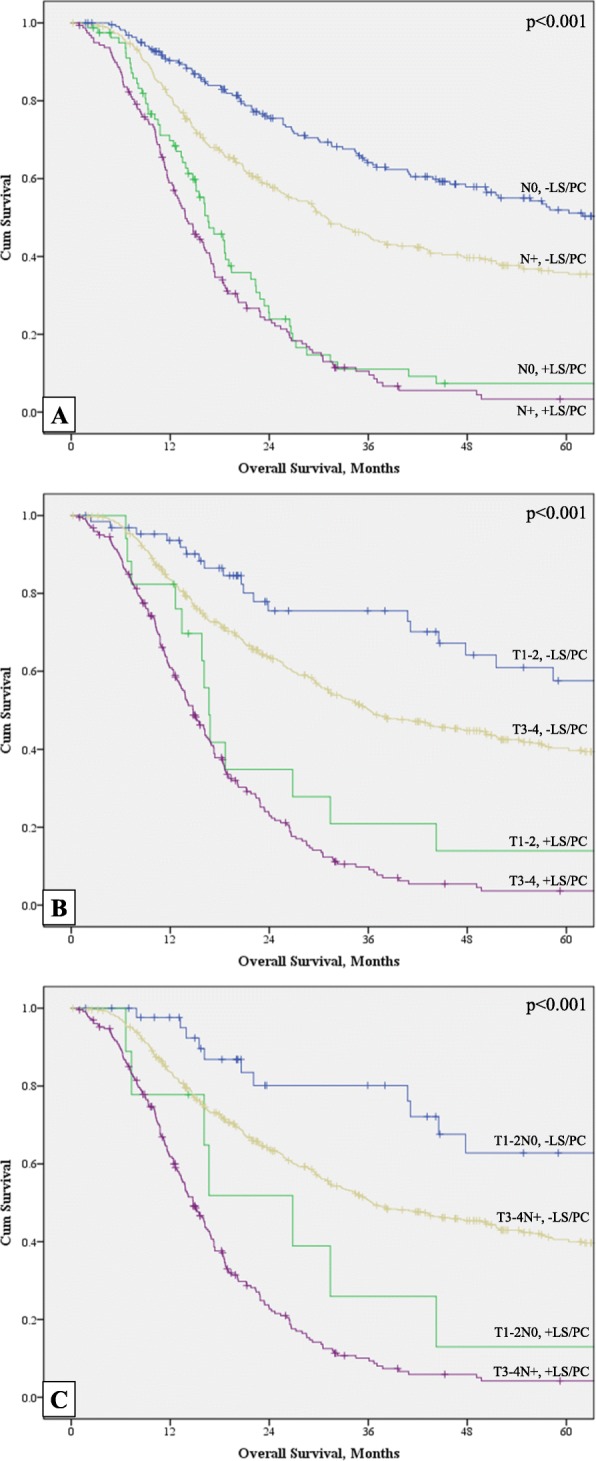
Kaplan-Meier survival analyses (n = 867). a Effect of SL/PC on survival stratified by N status. b Effect of SL/PC on survival stratified by T stage. c Effect of SL/PC on survival stratified by T and N status

Kaplan-Meier survival analyses (n = 867). a Effect of SL/PC on survival stratified by N status. b Effect of SL/PC on survival stratified by T stage. c Effect of SL/PC on survival stratified by T and N status