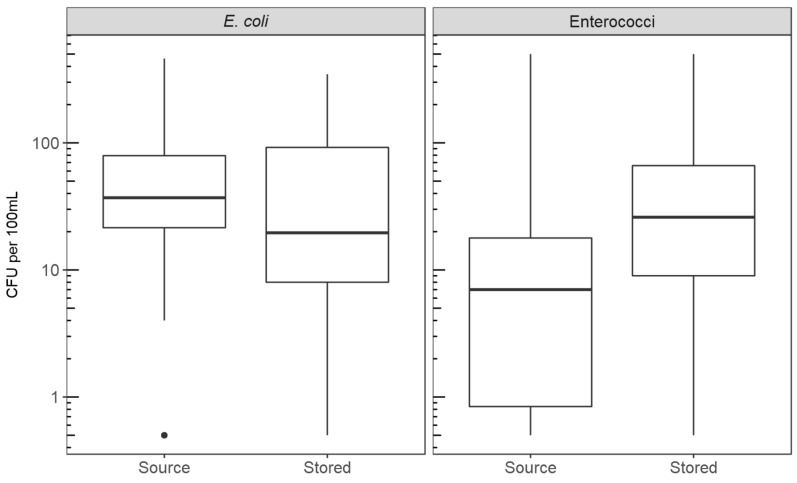
Figure 3.
Boxplots of the concentrations (CFU/100mL) of E. coli (left) and enterococci (right) in the source and stored water samples. The midline of the box represents the median of the data, with the upper and lower bounds of the box showing the first and third quartile. The whiskers show the extremes of the data that are within 1.5 times the interquartile range. Any data points outside this range are plotted as outlier circles (one outlier for E. coli concentration in source water).

