Figure 1.
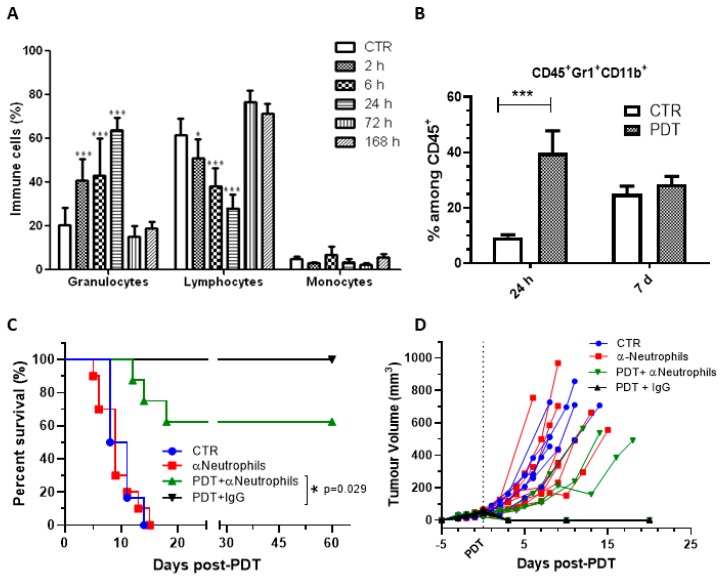
Redaporfin-PDT induces a strong neutrophilia, which contributes significantly for the treatment efficacy. (A) Relative percentage of blood leukocyte evaluated by flow cytometry at different time points after redaporfin-PDT. (B) Relative percentage of neutrophils (CD45+, GR1+ and CD11b+) evaluated by flow cytometry 24 h and seven days after redaporfin-PDT. Bars are the mean ± SD of six mice. No symbol p > 0.05; * p < 0.05; ** p < 0.01; *** p < 0.001. (C) Survival curve of mice bearing CT26.WT tumours treated with redaporfin-PDT in normal conditions or upon neutrophils depletion using Ly6G/Ly6C monoclonal antibodies. (D) Tumour growth represented individually for each mouse (6–11 mice per group). Survival curve statistics by LogRank (Mantel-Cox) test. No symbol: p > 0.05; * p < 0.05.

