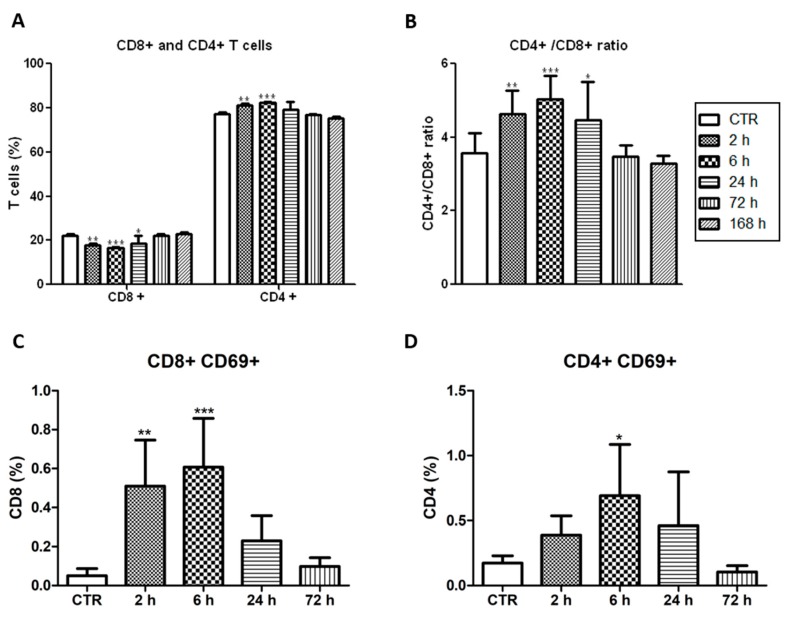
Figure 3.
Activated T cells after vascular-PDT with redaporfin. (A) Percentage of CD4+ and CD8+ T cells and (B) ratio of CD4+/CD8+ T cells in the blood of mice at different time points after vascular-PDT. (C) Percentage of CD8+ or (D) CD4+ T cells expressing CD69 in the blood of mice at different time points after PDT. Bars are the mean ± SD of five mice. No symbol: p > 0.05; * p < 0.05; ** p < 0.01; *** p < 0.001.

