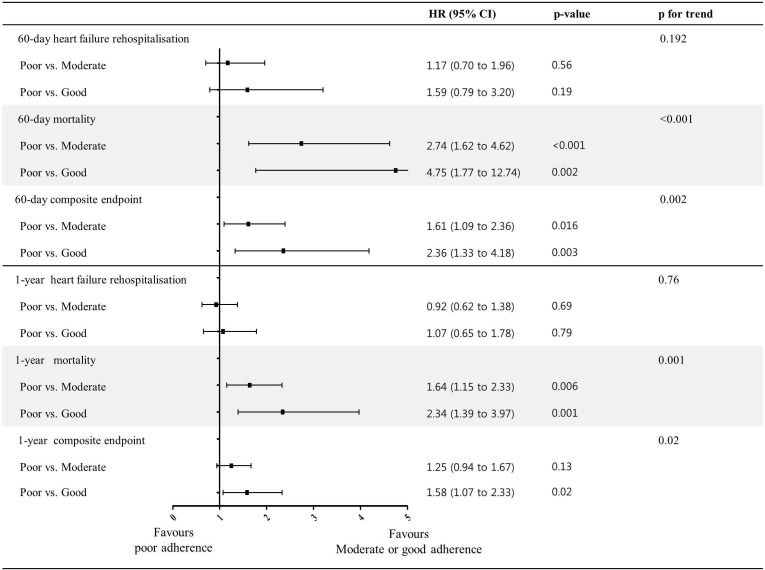
Figure 3.
Forest plot of clinical outcomes of poor guideline adherence compared with good and moderate guideline adherence. The HRs and 95% CIs in comparing the clinical outcomes of heart failure rehospitalisation, mortality and the composite end point, adjusted for sex, age, body mass index, history of hypertension, history of diabetes mellitus, history of ischaemic heart disease, history of chronic obstructive pulmonary disease, type of heart failure (de novo vs acute decompensated heart failure), New York Heart Association functional class, systolic blood pressure, heart rate, creatinine at admission and left ventricular ejection fraction.

