Fig. 6.
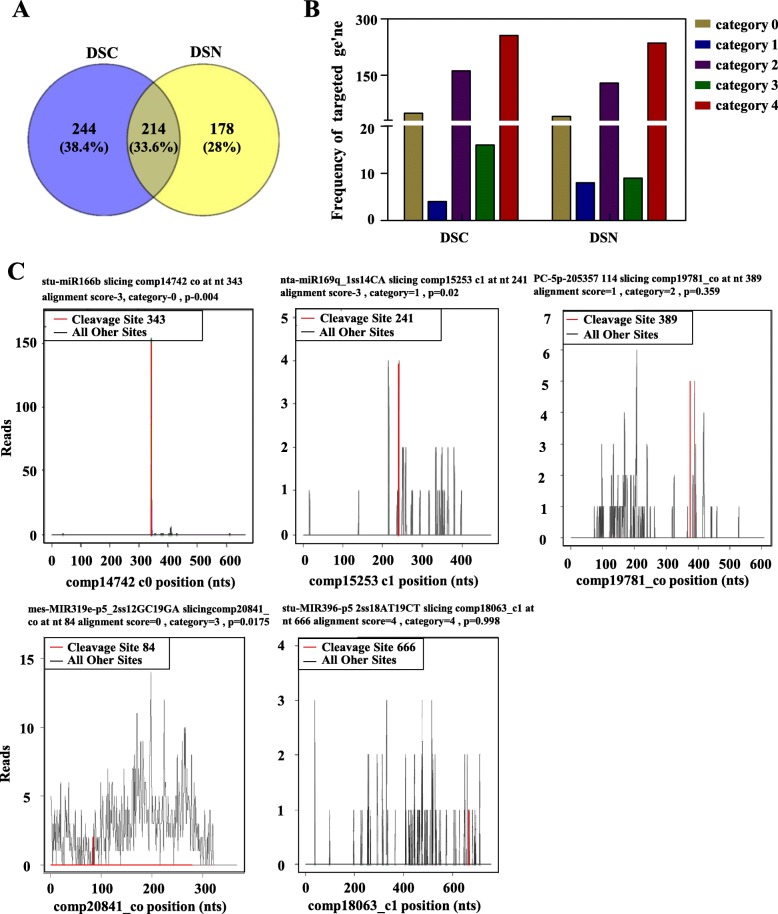
Target gene cleavage site analysis of miRNA. a Distribution of confirmed miRNA targets, separated by category in DSC library (left) and DSN library (right). b Distribution of target genes in two degradation group libraries. c Representative target plots (t-plot) depicting categories of the cleaved mRNAs confirmed by degradome sequencing, reflecting the reliability of the miRNA targets

