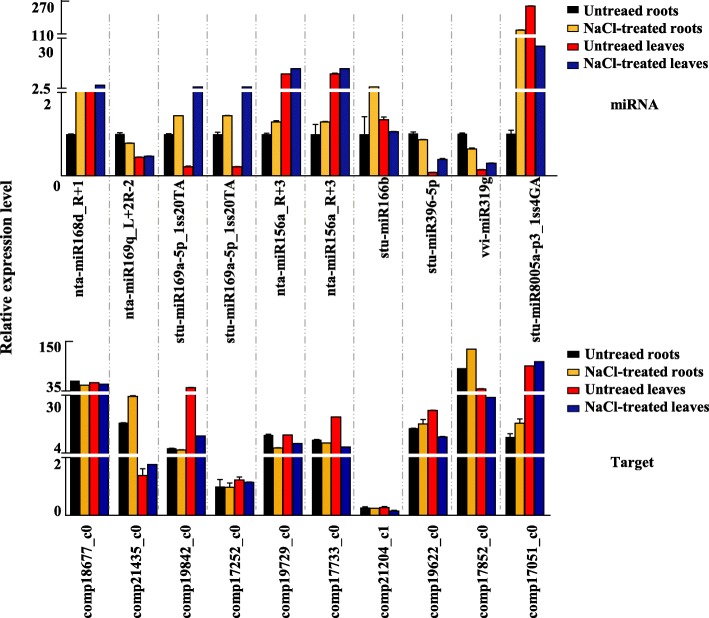
Fig. 8.
qRT-PCR analysis of miRNAs and their targets under salt stress. The relative expression of the 10 randomly selected sweet potato miRNA–target pairs were analysed by qRT-PCR. The ARF transcript levels were used for normalisation. Error bars indicate standard deviation. qRT-PCR value represents an average of three biological samples ± SE. MiRNA and its target primers are listed in Additional file 19: Table S14

