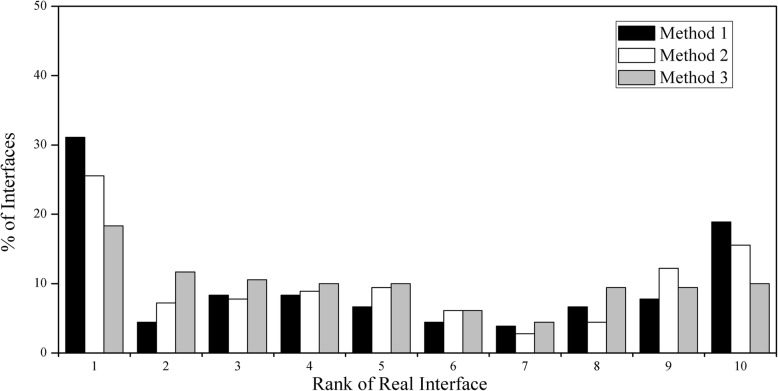
Fig. 7.
Ranking distribution of the real interface relative to all random surface patches according to the ρ value. Rank 1 means that the real interface is ranked the top 10% among it and all random surface patches, and rank 2 means the top 20%, etc. From method 1 to 3, the generated surface patch in a protein is more and more close to its own interface in size

