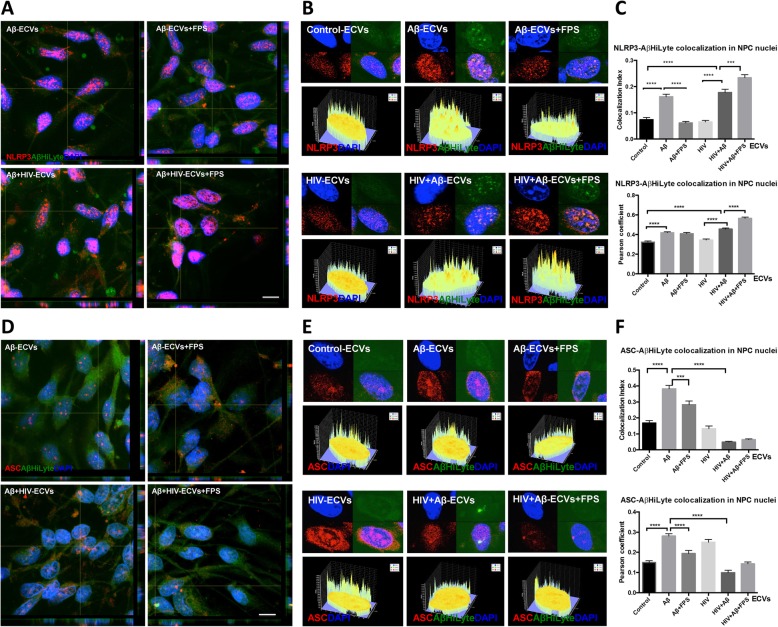
Fig. 4.
Aβ colocalization with inflammasome proteins in ECV-exposed NPCs. HBMEC were treated, and ECVs were isolated as in Figs. 2 and 3, followed by exposure to NPCs for 24 h. a NLRP3 immunoreactivity (red) and transferred Aβ (1–40) HiLyte (green) in NPCs as visualized by confocal microscopy. Nuclei are stained with DAPI (blue). Scale bar: 10 μm. b Nuclear colocalization of NLRP3 with Aβ (1–40) HiLyte. The graphs below the representative nuclear images depict fluorescence intensity profiles for colocalization of NLRP3 and Aβ (1–40) HiLyte in nuclear areas. c Quantification of NLRP3 and Aβ (1–40) HiLyte colocalization from B. d ASC immunoreactivity (red) and transferred Aβ (1–40) HiLyte (green) in NPCs as visualized by confocal microscopy. Nuclei are stained with DAPI (blue). Scale bar: 10 μm. e Nuclear colocalization of ASC with Aβ (1–40) HiLyte. The graphs below the representative nuclear images depict fluorescence intensity profiles for colocalization of ASC and Aβ (1–40) HiLyte in nuclear areas. f Quantification of ASC and Aβ (1–40) HiLyte colocalization from E. a & d Representative images from three experiments. c, f Values are mean ± SEM, n = 45–60. Statistically significant as compared to control at ***p < 0.001 or ****p < 0.0001

