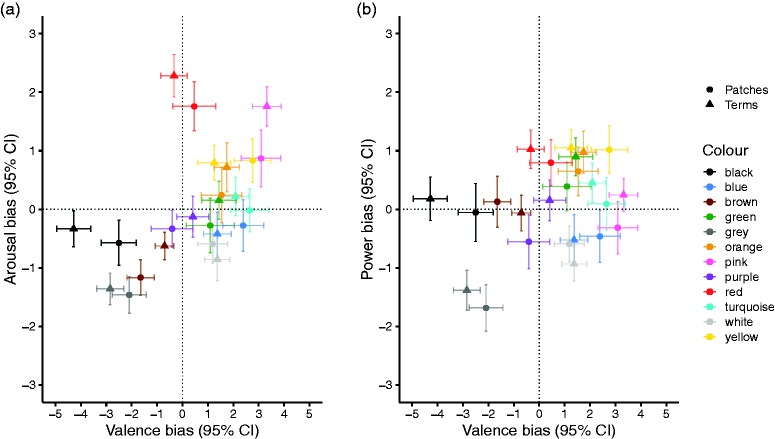
Figure 4.
Valence, arousal, and dominance biases of each colour term (triangles) and colour patch (circles). (a) Colours positioned in the Valence × Arousal Space. Valence bias was calculated by subtracting the number of negative emotion concepts from the number of positive emotion concepts associated with each colour (positive–negative); higher values indicate a more positive evaluation. Arousal bias was calculated by subtracting the number of low arousal emotion concepts from the number of high arousal emotion concepts associated with each colour (high arousal–low arousal); higher values indicate a more arousing evaluation. (b) Colours positioned in the Valence × Power Space. Power bias was calculated by subtracting weak emotion concepts from strong emotion concepts associated with each colour (strong–weak); higher values indicate a more empowering evaluation. (a and b) Error bars indicate 95% CIs of the mean. Dotted lines indicate the separation between positive–negative, high arousal–low arousal, and strong–weak emotion concepts. Colours are for visualisation purposes only. See Table S6 for the exact values. CI = confidence interval.

