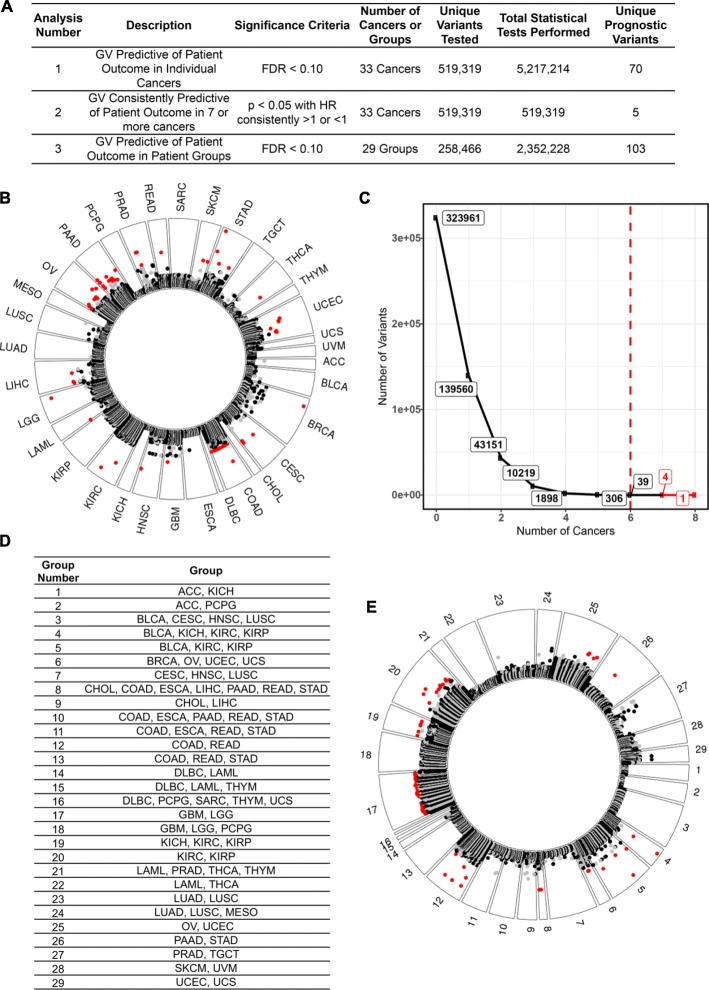
Fig. 1.
Prognostic germline variants identified in analyses 1 through 3. a A description of the three analyses used to identify prognostic germline variants in this figure. b Analysis 1. Germline variants found to be predictive of patient outcome in each cancer. Each dot represents a germline variant that was tested for an association with patient outcome. Variants closer to the outside of the plot are more closely associated with patient outcome. Variants in red are significantly (FDR < 0.10) associated with patient outcome. The alternating black and gray colors reflect alternating chromosomes for the germline variants that were not significant predictors of patient outcome. c Analysis 2. Germline variants found to be recurrently predictive of patient outcome in multiple different cancers. We identified five total germline variants that were recurrently predictive (p < 0.05) of favorable (HR < 1) or poor (HR > 1) patient outcomes in seven or more different cancers. d Analysis 3. A total of 29 groups of cancers created to identify germline variants with weaker effect sizes in larger patient cohorts. Justification for these groups is provided in Additional file 1: Table S3. e Analysis 3. Germline variants found to be predictive of patient outcome in the groups described in Fig. 1d. The format of the figure is the same as in Fig. 1b.

