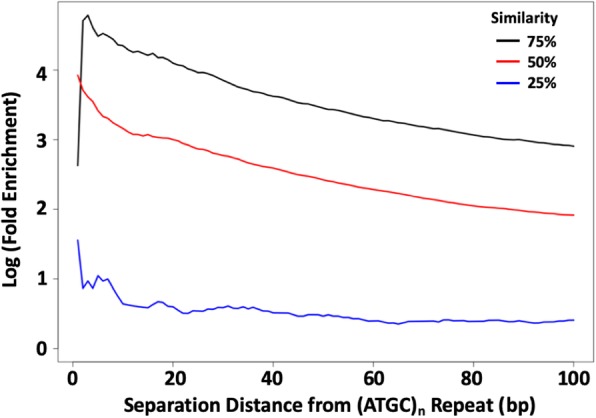
Fig. 2.

Enrichment of similar SSR loci near ATGC repeat loci. The average enrichment levels of perfect SSR loci within 100 bp of a perfect ATGC repeat locus are shown for SSR families with motifs with 1 difference (75% similar, black), 2 differences (50% similar, red), or 3 differences (25% similar, blue) from the ‘ATGC’ motif. Enrichment for SSR motifs was determined relative to the genomic average for all possible motifs with the given difference
