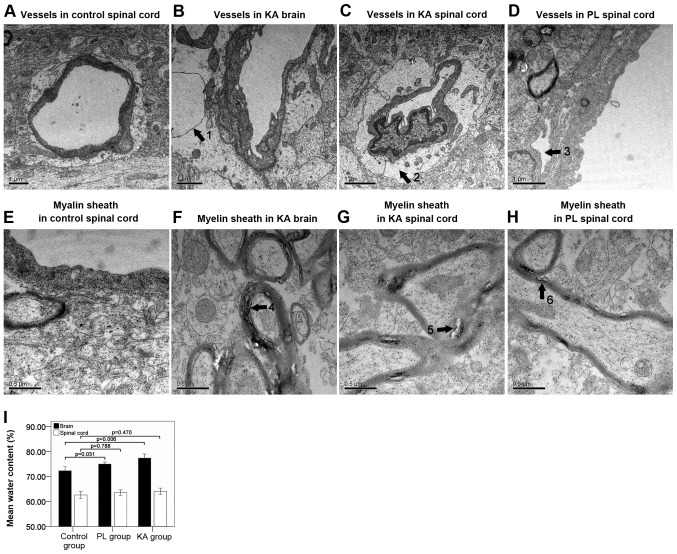
Figure 2.
Tissue damage following seizure shown by transmission electron microscopy. (A) Normal vessel structure in the control group. Edema and vacuolization of the basement membrane in the (B) brain and (C) spinal cord in the KA group. (D) Separation of the basement membrane in the spinal cords of the PL group. Scale bar, 1 µm. (E) Normal myelin sheath structure in the control group. Significant structural looseness and separation of the myelin sheath in the (F) brain and (G) spinal cord in the KA group. (H) Structural looseness of the myelin sheath in the spinal cords of the PL group. Scale bar, 0.5 µm. (I) Analysis of the brain water content showed different degrees of edema in the brain and spinal cord in the KA and the PL group. Arrow one, vacuolization. Arrow two, edema of the basement membrane. Arrow three, separation of the basement membrane. Arrows 4–6, looseness and separation of the myelin sheath. PL, pilocarpine; KA, kainic acid.

