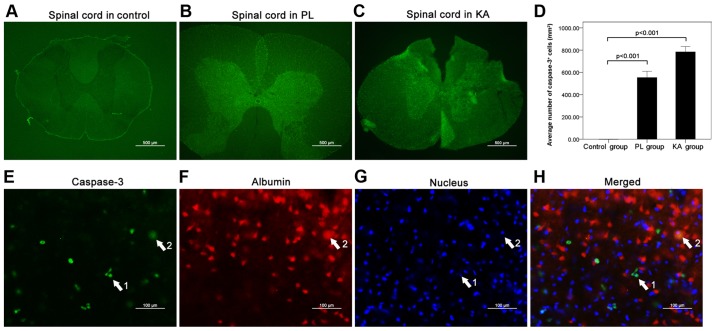
Figure 8.
Apoptosis in the spinal cord following TLE. (A) Caspase-3 was not detected in the control group spinal cord tissues. Increased expression levels of caspase-3 were observed in the spinal cord after TLE in the (B) PL and (C) KA groups. Scale bar, 500 µm. (D) Quantification of the average number of casapase-3+ cells. (H) Multiple-staining (E) of caspase-3, (F) albumin ad the (G) nucleus indicated a small degree of caspase-3 staining in albumin+ cells. Arrow one, merged caspase-3 and nuclei staining. Arrow two, merged caspase-3, albumin and nuclei staining. TLE, temporal lobe epilepsy; PL, pilocarpine; KA, kainic acid.

