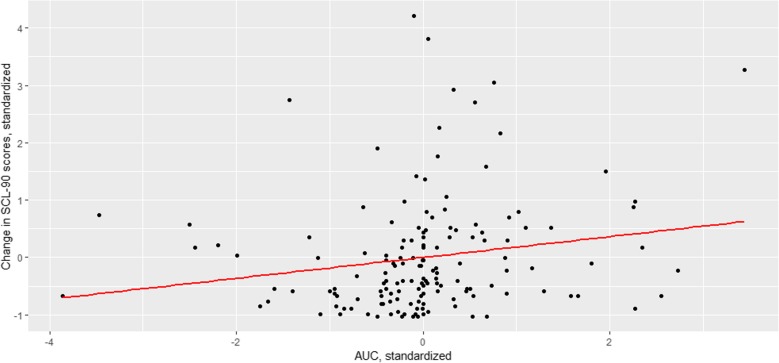
Fig. 3.
Speed of negative affect recovery as a predictor of individual symptom trajectories. In this figure, the y-axis depicts the standardized score of the change of SCL-90 from baseline to follow-up. 0 represents the mean change in Stable and Increase group (i.e., increase of 10.21 points), and each step of 1 corresponds to 1 SD increase (or decrease) in the SCL-90. x-axis depicts the standardized score of area under the curve with respect to baseline (AUCb) of the negative affect recovery after the negatively appraised events: 0 represents the mean AUC, and the step of 1 SD increase (or decrease) in the AUCb. Thus, smaller values indicate smaller AUCb and therefore faster affect recovery, and larger values represent larger AUCb and therefore slower affect recovery. The fitted line represents the linear relationship between change in SCL-90 scores and speed of affect recovery, depicting a small positive correlation between these variables, meaning that the increase in the level of SCL-90 is positively correlated with the longer affect recovery

