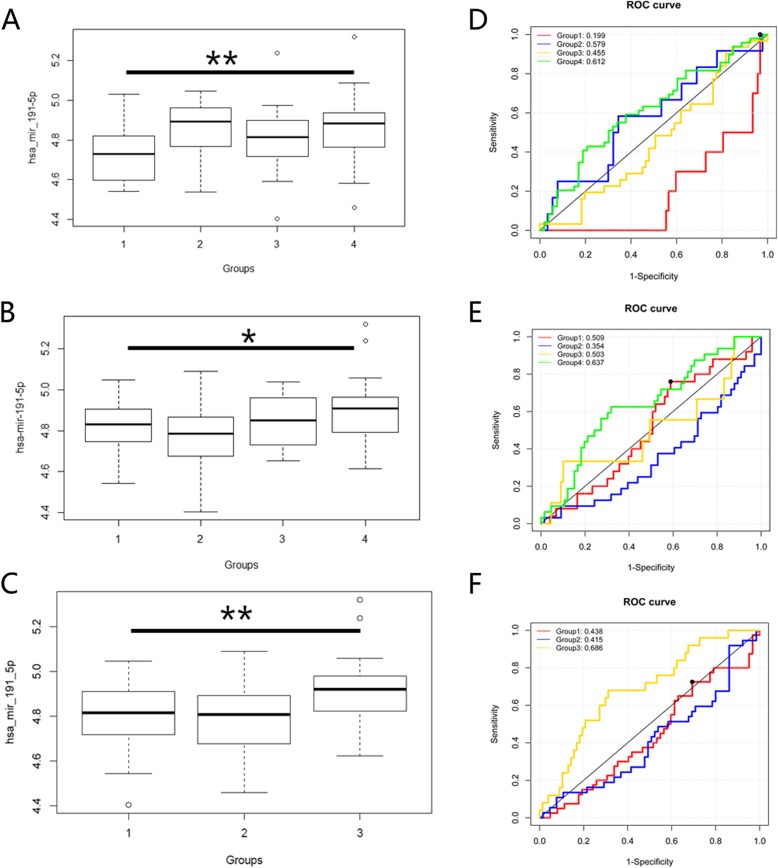
Fig. 3.
Comparison of hsa-mir-191-5p expression: a Differential expression of hsa-mir-191-5p in sperm samples from patients with different FRs. b Differential expression of hsa-mir-191-5p in sperm samples from patients with different EERs. c Differential expression of hsa-mir-191-5p in sperm samples from patients with different HQER. d When hsa-mir-191-5p was used as a single predictor, the ROC curves of patients in different FR groups were obtained. e When hsa-mir-191-5p was used as a single predictor, the ROC curves of patients in different EER groups were obtained. f When hsa-mir-191-5p was used as a single predictor, the ROC curves of patients in different HQER groups were obtained

