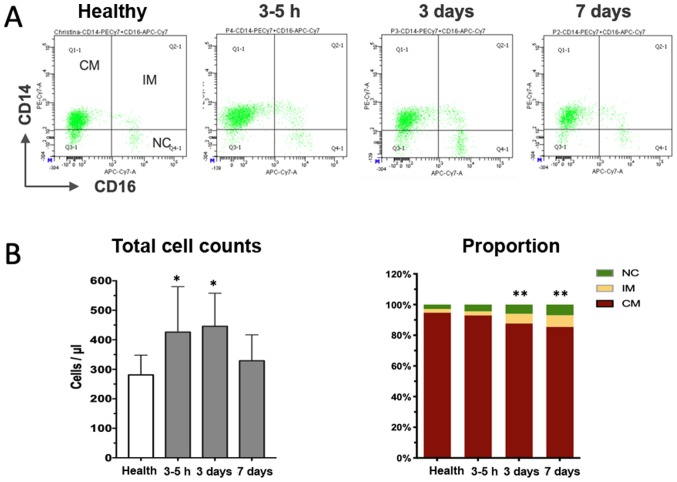
Figure 2.
Dynamical changes of monocyte subsets after myocardial infarction. (A) Representative illustration of three monocyte subsets according to CD14 and CD16 staining at different time-points. (B) Quantitative analysis indicated that the total cell counts initially increased (3–5 h) and then declined almost to the level of healthy controls (left panel in B). The right panel in B displays the proportional changes of three subsets of monocytes over time, revealing the progressive increase of the percentage of the IM subpopulation. *P<0.05, total cell counts vs. healthy; **P<0.01, proportion of IM vs. healthy. CM, classical monocytes; NC, non-classical subsets; IM, intermediate subpopulation; PE, phycoerythrin; APC, allophycocyanine; Cy, cyanine; FSC, forward scatter; SSC, side scatter; Q, quadrant.

