Fig. 1.
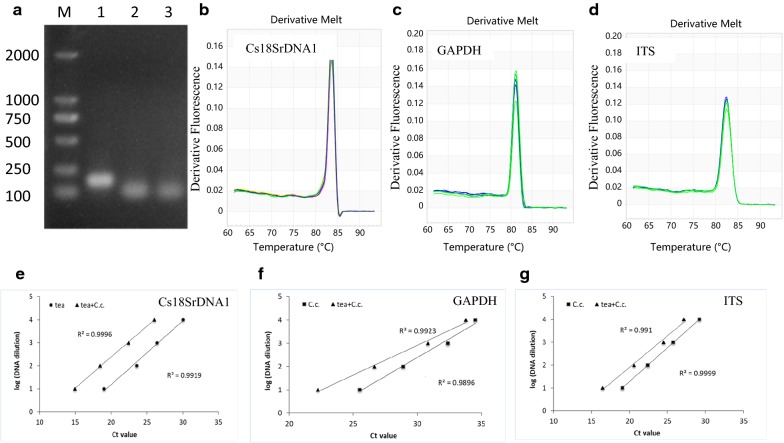
Validation of primers for biomass quantification of tea plant and pathogen. a Amplification results for three genes using C. camelliae (C.c)-infected tea plant DNA. DNA. M: DL2000 Marker, 1: Cs18SrDNA1, 2: GAPDH, 3: ITS. b–d Melting curve analyses of three genes. Each qRT-PCR product had a single melt curve indicating the breakdown of only one PCR product. b Cs18SrDNA1, c GAPDH, d ITS. e–g The primer efficiency for the PCR quantification of the gene was determined using a serial dilution of DNA templates from tea plant, C. camelliae (C.c), and C. camelliae-infected tea plant (tea + C.c). e Cs18SrDNA1, f GAPDH, g ITS. The respective correlation coefficients (R2) are indicated

