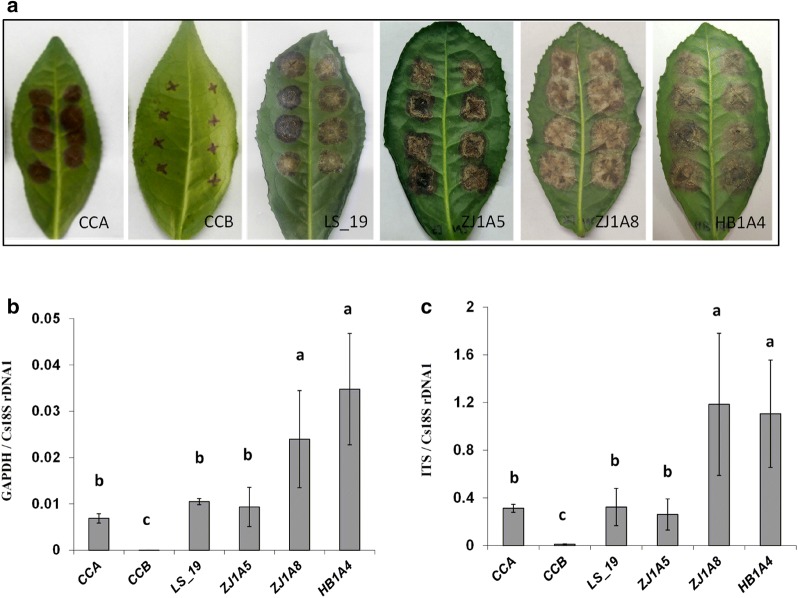
Fig. 5.
Quantification of different isolates of C. camelliae on tea plant cultivar LJ43. a Photos of anthracnose leaf symptoms developed 6 days post inoculation (6 DPI). CCA: C. camelliae CCA; CCB: C. camelliae CCB; LS_19: C. camelliae LS_19; ZJ1A5: C. camelliae ZJ1A5; ZJ1A8: C. camelliae ZJ1A8; HB1A4: C. camelliae HB1A4. b, c qRT-PCR-based biomass of six C. camelliae isolates grown on tea plants (6 DPI). b The ratio of the primer pairs GAPDH/Cs18SrDNA1 was used to determine fungal biomass. c The ratio of the primer pairs ITS/Cs18SrDNA1 was used to determine the fungal biomass. The letters a, b and c represent significant differences between the quantification of different isolates of C. camelliae according to LSD test (P < 0.05)

