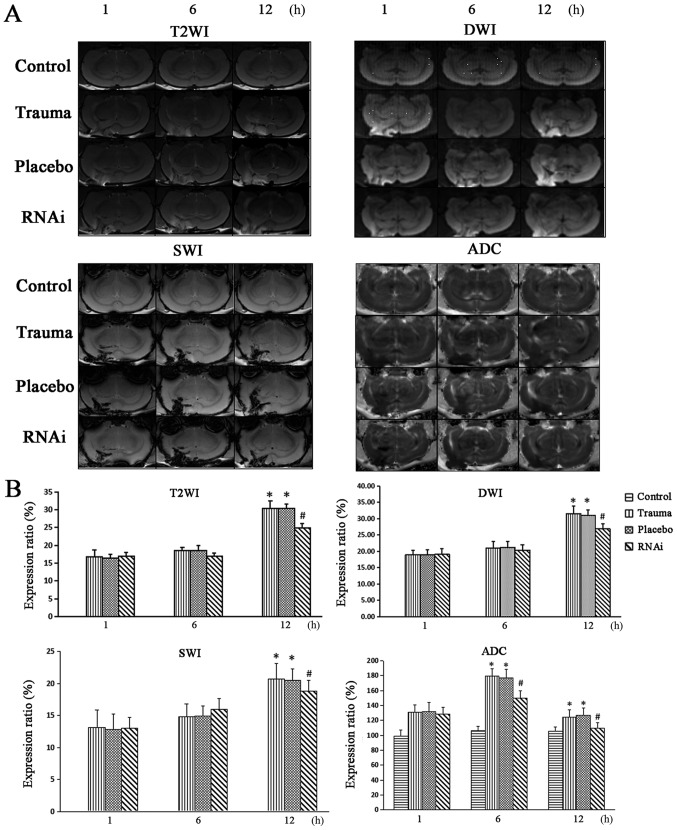
Figure 4.
Multi-modal MRI images. All rat groups were imaged using a 7.0t MRI including DWI, T2WI, SWI and ADC sequences. (A) MRI images of rats' brain. (B) Ratio of the area with abnormal signals in all sequences (the ratio of control group is 0 in the T2WI, DWI and SWI sequences). The data are presented as the mean ± standard deviation from at least three independent experiments. *P<0.05 vs. control group. #P<0.05 vs. trauma group. DWI, diffusion-weighted MRI; T2WI, T2 weighted image; SWI, susceptibility weighted image; ADC, apparent diffusion coefficient; RNAi, RNA interference.

