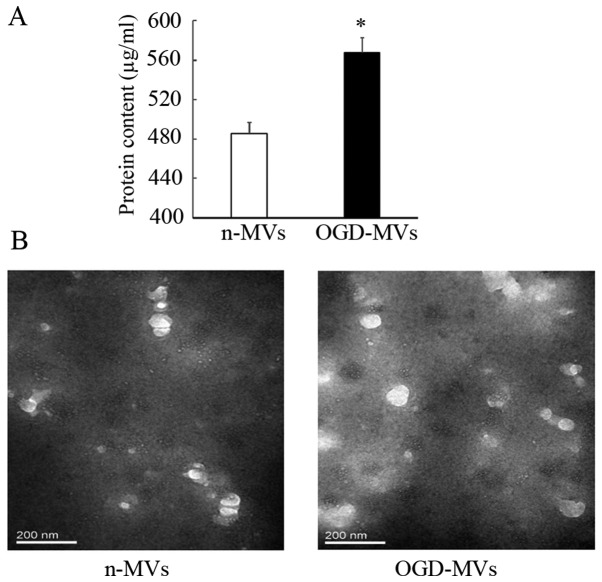
Figure 2.
OGD treatment increases the release of MVs from EPCs. (A) Total protein content of MVs was quantified; *P<0.05 vs. normoxic group. (B) Images of MVs collected from the aliquot of EPCs culture medium using ultracentrifugation in the normoxic group and OGD group, captured by a transmission electron microscope (scale bar, 200 nm). MV, microvesicle; OGD, oxygen-glucose deprivation; n-MVs, MVs in normoxic culture; EPC, endothelial progenitor cell.

