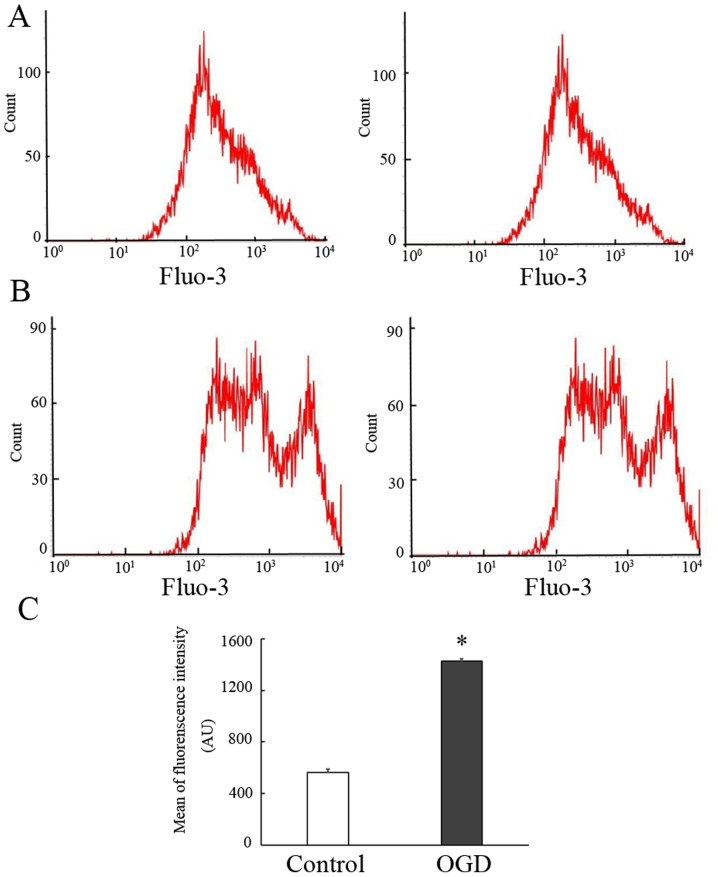
Figure 3.
Intracellular Ca2+ levels in endothelial progenitor cells were detected by Fluo-3/AM flow cytometry. (A and B) Flow cytometric analysis of intracellular Ca2+ levels in (A) the normoxic group and (B) OGD group. (C) Histograms of Ca2+ fluorescence intensity in the normoxic group and OGD group. *P<0.05 vs. normoxic group (mean ± standard deviation, n=4). OGD, oxygen-glucose deprivation.

