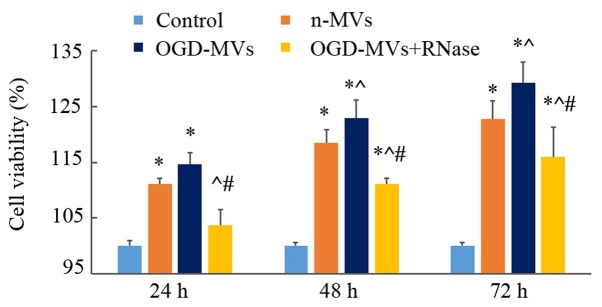
Figure 6.
Effects of MVs on EPC proliferation as measured by a Cell Counting Kit-8 assay. EPCs were co-cultured with MVs released from cells with different pre-treatments. EPCs in the three co-cultured groups exhibited increased proliferation compared with that of monocultured EPCs, and MVs released from the group pre-treated with OGD exhibited the highest proliferative effects, which was counteracted by RNase. *P<0.05 vs. control group, ^P<0.05 vs. n-MV group, #P<0.05 vs. OGD-MVs group (mean ± standard deviation, n=4). EPC, endothelial progenitor cell; MV, microvesicle; OGD, oxygen-glucose deprivation; n-MVs, MVs in normoxic culture.

