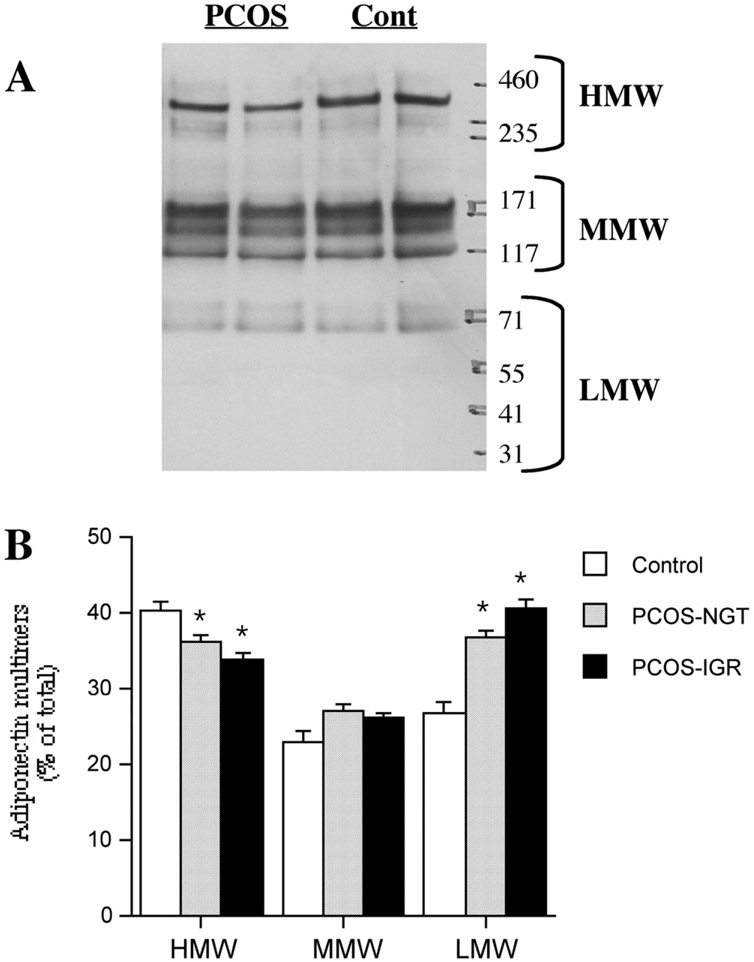
FIGURE 2.
Distribution of adiponectin between multimers in the serum of control, normal glucose tolerant– polycystic ovary syndrome (NGT-PCOS) and impaired glucose response (IGR)-PCOS subjects. Equal amounts (2 μL) of serum loaded for each individual. (A) Representative Western blots of 2%−8% tris-acetate gels run under nonreducing conditions. (B) Quantitation of blots. Results are expressed as percent of the total densitometric signal for each individual, within each lane. Results are average ±SEM, n = 6 for control, 10 for NGT, 16 for IGR. *P<.05 vs. control (Cont). HMW = high molecular weight; MMW = medium molecular weight; LMW = low molecular weight.

