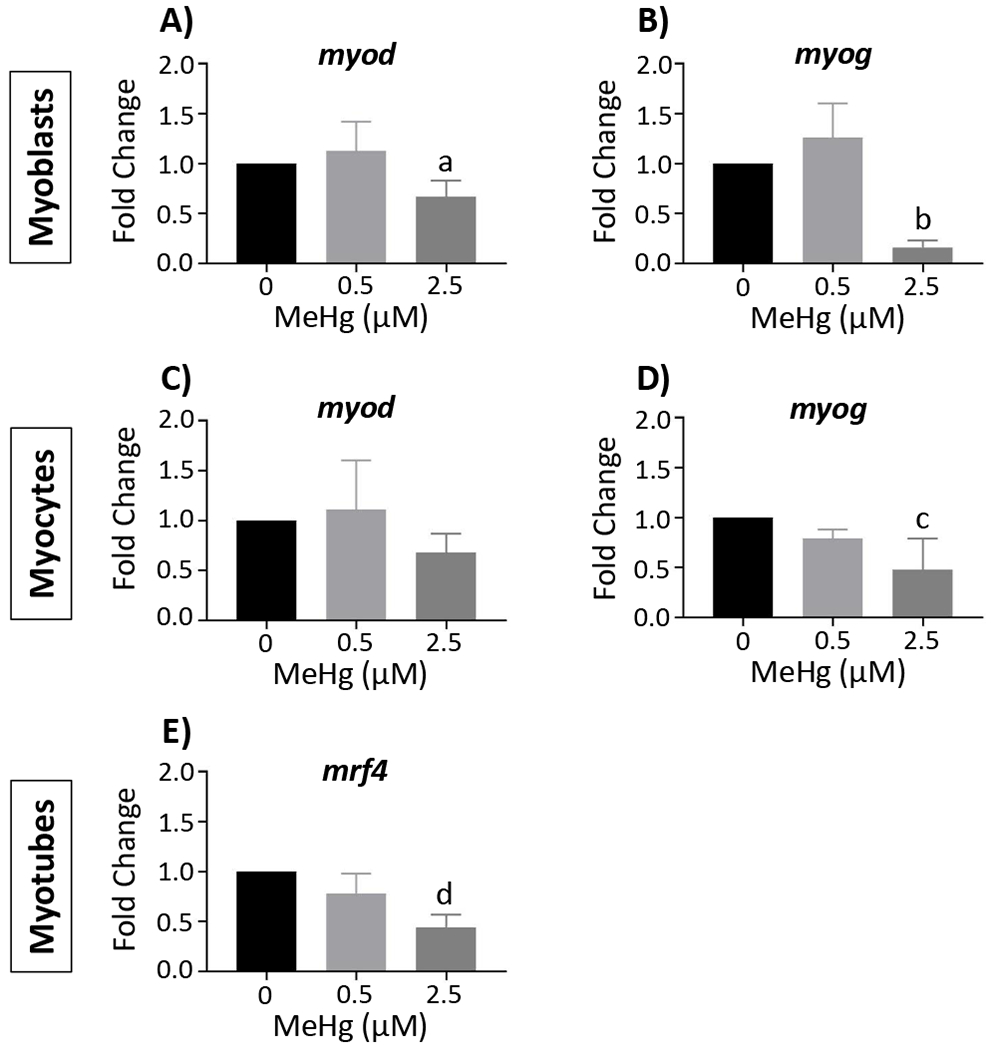
Figure 3. MeHg effects on MRF gene expression.

Gene expression was determined by real-time qPCR. Myod and myog expression are presented in the myoblasts (A and B) and myocytes (C and D), respectively, while mrf4 expression is presented in the myotubes (E). Data are reported as fold change, and represent the mean ± SD; aone-way ANOVA, Tukey’s HSD, p < 0.05; bone-way ANOVA, Tukey’s HSD, p < 0.001; cKruskal-Wallis, Dunn’s Multiple Comparisons, p < 0.01; done-way ANOVA, Tukey’s HSD, p < 0.01 (See also suppl. Table 2)
