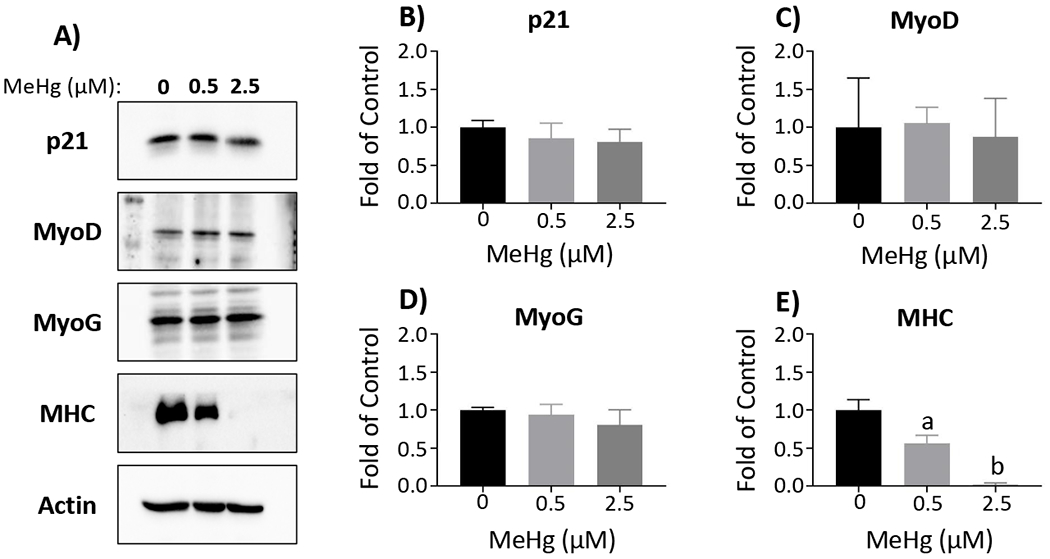
Figure 6. MeHg effects on protein levels of differentiation factors in myotubes.

Representative Western blots for p21, MyoD, MyoG, MHC, and actin are displayed (A). Band intensity was quantified using ImageJ and normalized to actin, prior to comparison between MeHg concentrations. Total protein was quantified for p21 (B), MyoD (C), MyoG (D), and MHC (E). Data are reported as fold of control, and represent mean ± SD; aone-way ANOVA, Tukey’s HSD, p < 0.01; bone-way ANOVA, Tukey’s HSD, p < 0.001
