
Figure 4.
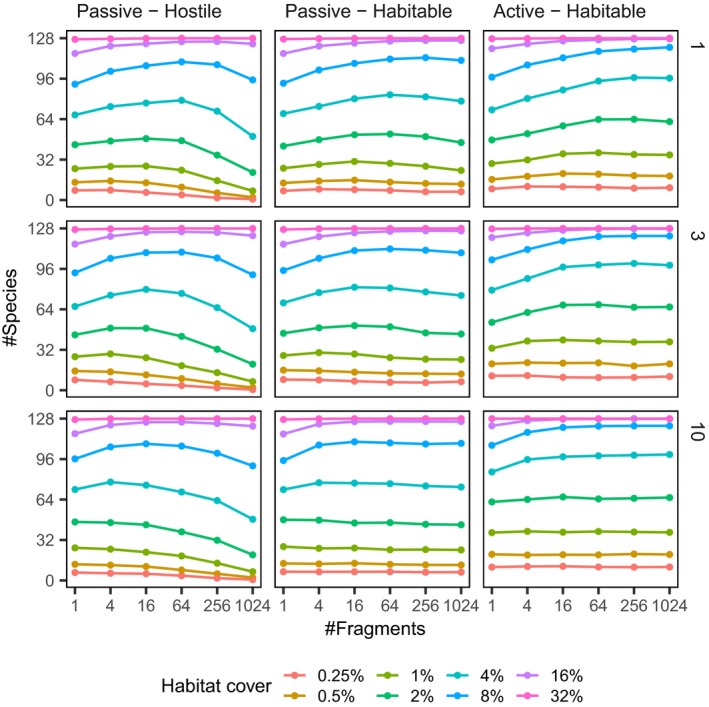
Species richness as a function of habitat fragmentation for the different scenarios. Each point represents the average species richness in landscapes with given number of habitat fragments and amount of total habitat. The vertical axis gives average species richness in landscapes, whereas the horizontal axis represents the degree of fragmentation (in logarithmic scale, fragmentation increases from left to right) and colours denote the total amount of habitat cover. The columns represent different dispersal/matrix scenarios and rows represent different dispersal ranges.