
Figure 5.
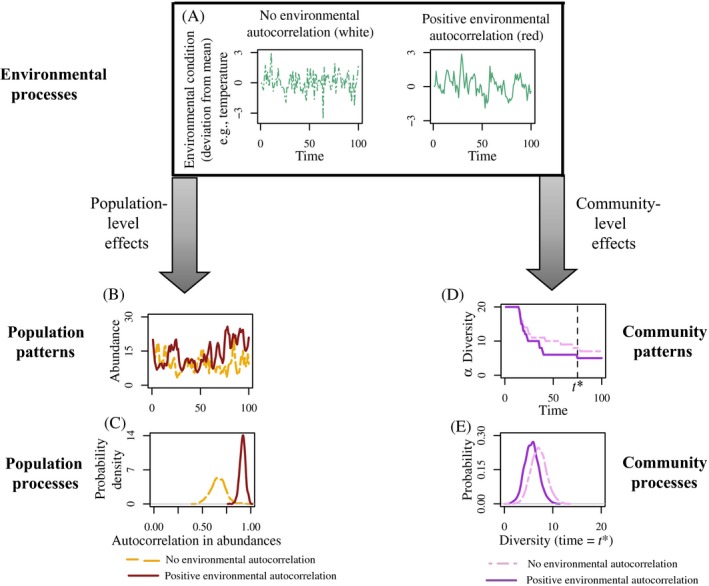
Modeling environmental stochasticity in populations and communities. Modeled effects of autocorrelation in environmental stochasticity (A) alters population and community patterns ( for white noise; for red noise). In compensatory populations, increasing the strength of positive autocorrelation in environmental stochasticity increases the correlation in population size between time steps (B, C). In contrast, in communities where environmental stochasticity alters the germination rate from the seedbank, environmental autocorrelation has a more minimal effect, but increasing the strength of positive autocorrelation in environmental stochasticity slightly decreases expected diversity (D, E). Population model parameters are and (Eq. 3). Community model parameters are and when , and (Eq. 7).