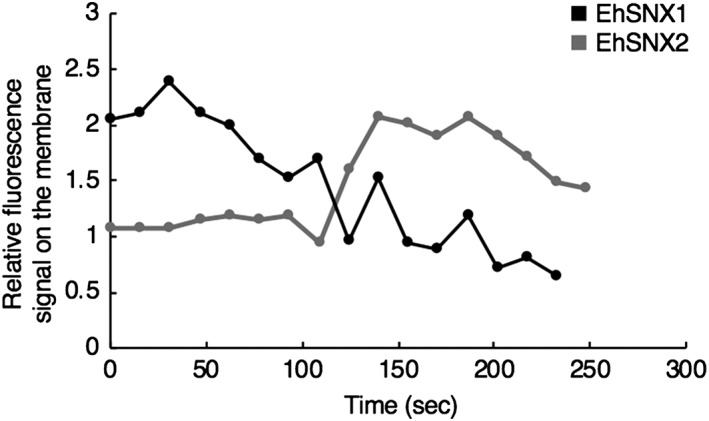
Figure 5.

Kinetics of association of GFP‐EhSNX1/2 to the trogosome membrane during Chinese hamster ovary (CHO) cell internalisation. Fluorescence intensity of GFP‐EhSNX1/2 on the trogosome membrane relative to the cytoplasm was monitored during trogocytosis of CHO cells. The images started to be collected 4–7 s after the initiation of the trogocytic cup formation, and this timing was set to zero. Y‐axis represents the mean fluorescence signal per pixel of GFP‐SNX1/2 on the trogosome membrane relative to that in the cytosol. One representative image each of three independent experiments is shown. Only representative movies were analysed, but other movies also showed similar kinetics
