Figure 7.

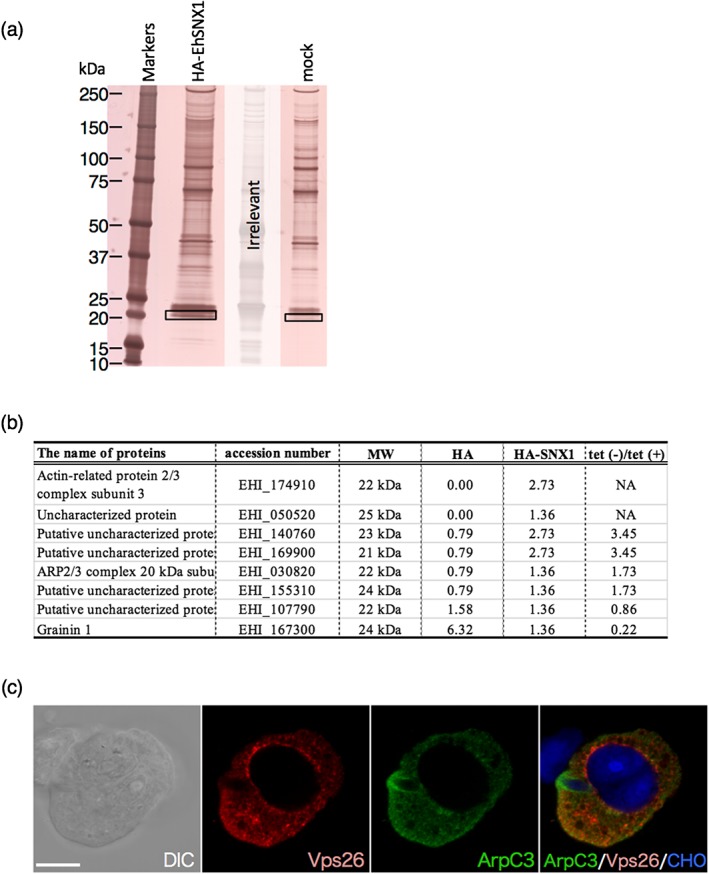
Identification of candidate binding proteins of EhSNX1. (a) Silver‐stained SDS‐PAGE gel of the immunoprecipitated samples from HA‐EhSNX1 and mock transformants using anti‐HA antibody. The rectangles indicate the region of the specific band excised from HA‐EhSNX1 and its corresponding region from control. (b) The proteins that were detected from the unique band specifically recognised from HA‐EhSNX1‐expressing transformants by immunoprecipitation using anti‐HA antibody. Proteins that were not detected from the HA‐EhSNX1 are excluded from the table. The values indicate the relative frequency of the detected peptides corresponding to each protein. “HA‐EhSNX1/HA” indicates the division of the value of HA‐EHhSNX1 by the value of HA control. A whole list of the detected proteins is found in Table S2. (c) The localisation of EhArpC3 and EhVps26 during trogocytosis. FLAG‐EhArpC3 transformant was co‐cultured with CHO cells stained with CellTracker Blue for 15 min. FLAG‐EhArpC3 and EhVps26 were detected using anti‐FLAG antibody and anti‐EhVps26 antiserum, respectively. FLAG‐EhArpC3 is shown in green; EhVps26 is shown in red. Scale bar is 10 μm
