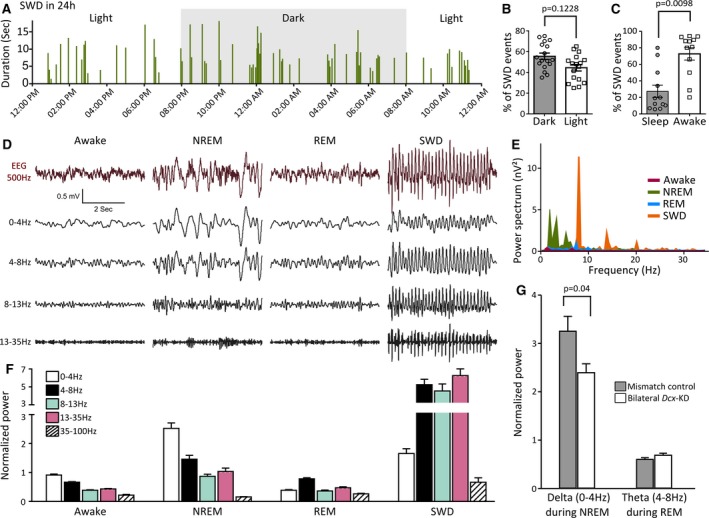
Figure 4.

Spike‐and‐wave discharges (SWDs) across the natural sleep/wake cycle in bilateral Dcx‐knockdown (KD) rats. A, Bar graph illustrating the occurrence and duration of SWDs across different phases of the dark‐light cycle in a representative bilateral Dcx‐KD rat. Individual bars indicate the occurrence of an SWD event, and their height show their duration (in seconds). B, C, Bar graphs showing the percentage of SWD events occurring during the dark and the light period (B), and during sleep and awake state (C). Open circles and squares in B and C correspond to values for individual rats. D, F, Representative raw and band‐pass filtered electroencephalographic (EEG) traces at different vigilant states and during SWDs (D) and corresponding power band analysis (F). Averaged and normalized power values from 13 bilateral Dcx‐KD rats were used. NREM, non–rapid eye movement; REM, rapid eye movement. E, Comparative power spectrum analysis of short EEG traces (2 seconds, 0‐35 Hz) sampled during SWDs, wake, and NREM and REM sleep, showing a dominant ~9‐Hz peak of high power during SWDs, accompanied by other peaks at harmonic frequencies. G, Bar graphs illustrating normalized delta during NREM and theta during REM in bilateral Dcx‐KD rats compared to mismatch controls
