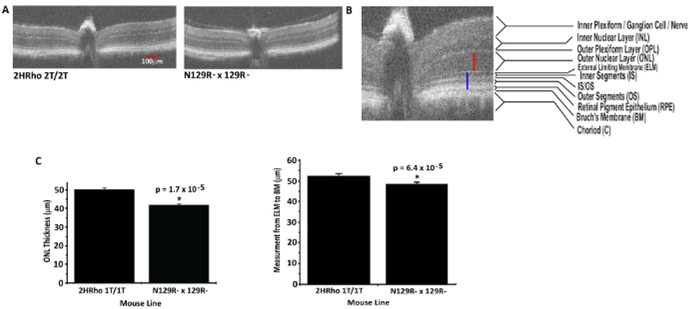
Figure 3: Quantitative measures of Outer Nuclear Layer and Outer segment length using HR-SD-OCT.
(A) Mouse lines used to demonstrate ONL and OSL measures. Representative OCT images from 2HRho1T/1T (2 doses HRho) on mouse RHO knockout background) (Left panel) and N129R- x 129R- (one dose human RHO on mouse RHO knockout background)(Right panel). (B) An example of how calipers were placed to measure the ONL (red) and OSL (blue) is shown. (C) The data obtained from three animals of each line for ONL thickness was plotted in bar graph format showing comparison of 2HRho1T/1T line and N129R- x 129R- (Left panel). The 2HRho1T/1T line has ~8 μm thicker ONL. To demonstrate differences in OSL, multiple measurements (seven) were made from one b-scan from each mouse line from the ELM to the BM as in B (blue line) in 9-week-old animals (Right panel). This demonstrated a ~5 μm difference in the OSL between animals with 1 vs 2 copies of the HRho gene. Both ONL and the OSL measures were statistically significant, ONL p-value = 1.7e-5 and OSL p-value = 6.4e-5. Error bars = standard error of the mean. Red scale bar = 100 μm both the b-scans in 3A have the same scale, 3B is zoomed to improve clarity of the retinal layers and to provide a qualitative demonstration of how the measurements were acquired.

