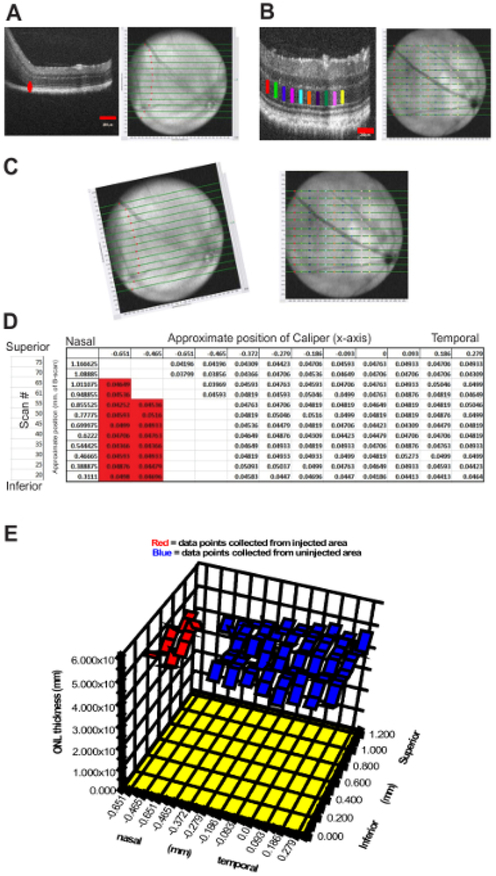
Figure 5: Mapping and Quantifying Outer Retinal Changes following Subretinal injection.
A method was developed to identify regions of interest during follow-up examination of mice that had subretinal injection of vector, with 3D-plotting of ONL measurements from multiple OCT b-scans. A 2HRho1T/1T animal was injected with a self-complementary adeno-associated virus expressing both GFP and the lead candidate hammerhead ribozyme (scAAV-GFP ad6 hhRz 725) (OS eye) in a toxicity screen. (A) Imaged immediately following, the areal extent of the injection was mapped by placing calipers at the leading edge of the bleb at the point where the outer segments separate from the RPE in the b-scans (Left panel (red caliper)). The position of the caliper tool is automatically mapped to the fundus image, and this is repeated and compiled for as many b-scans as necessary, which depend upon the desired resolution (every 5th scan in (A) (right panel)). Subsequent OCT studies (every 2 weeks) imaged the same region of the retina to allow superimposition; the ONH and retinal blood vessels are landmarks to facilitate the Cartesian or rotational adjustments. The entire region of the retina was measured for ONL thickness provided the required boundaries (OPL and ELM) were visible. (B) To map the ONL length over the injected surface the caliper positions (color coded) are again mapped onto the fundus image and compiled into a composite image. Every 5th b-scan from the OCT images was measured with built-in calipers at up to ten points across the retina. (C) Pre- and post-compiled images are rotated, using imaging software to align retinal vasculature, which allows data points within the detached retinal region retina to be identified by image overlay and separated. (D) The data set is mapped into a table format, identical to the fundus image array, and divided into two groups (measurements within the bleb (red highlights) and those that are not). (E) Data is presented using a 3D surface plotting feature, which allows visualization of ONL thickness over the entire imaged region. This allows assessment of quantitative differences between injected and non-injected regions of the eye. The crevice in the 3D plot (E) provides a convenient way to segregate the data set of ONL measurements within the region of the detached retina from the region that remained attached immediately following injection.

