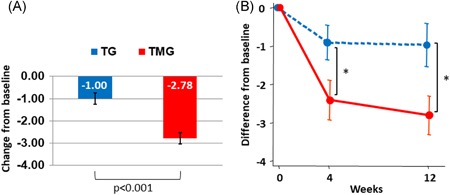
Figure 2.

A, Primary endpoint: change from baseline to 12 weeks in OABSS total score. P value was calculated using ANCOVA, with group and baseline OABSS as covariates. Mean ± SE. B, Mean difference of OABSS total score (mean ± 95% CI) before (week 0), and at weeks 4 and 12 after the therapy: dotted line represents TG and straight line represents TMG. *P < .001, between groups. ANCOVA, analysis of covariance; CI, confidence interval; OABSS, OAB symptom score; TG, tadalafil monotherapy group; TMG, mirabegron combination therapy group
