Figure 5.

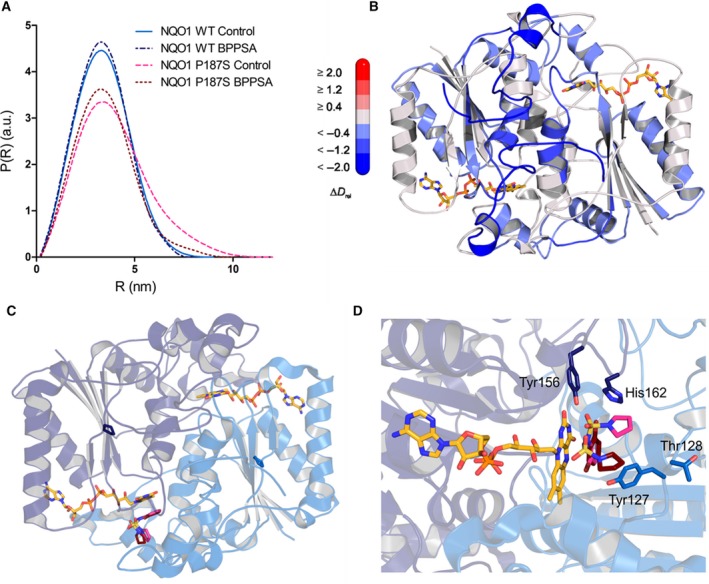
SAXS radial density distribution and conformational dynamics observed by HDX‐MS and crystal structure of NQO1 WT with docked BPPSA. (A) Small‐angle scattering measurement of NQO1 WT and the P187S variant in the presence and absence of BPPSA. The SAXS data displays a comparison of the experimental radial density distribution (P (R)) of NQO1 WT control (light blue), NQO1 WT with BPPSA (dark blue), the NQO1 P187S variant control (pink), and the NQO1 P187S variant with BPPSA (maroon). (B) Structure of the NQO1 P187S variant (PDB code: http://www.rcsb.org/pdb/search/structidSearch.do?structureId=4CET) with colors corresponding to the relative incorporation of deuterium, ∆D rel, between the NQO1 P187S variant in presence of BPPSA relative to the NQO1 P187S variant without BPPSA after 6 min of deuteration. The scale bar indicates the changes in ∆D rel where blue corresponds to less incorporation of deuterium and red to higher incorporation. (C) and (D) Structure of NQO1 WT with BPPSA. (C) Overall structure of NQO1 WT with the 2 protomers colored in different shades of blue. The amino acid position P187 that is replaced with serine in the variant protein is highlighted. FAD is colored yellow and the ligand BPPSA is colored in pink and maroon. (D) Binding of BPPSA to the active site with an overlay of the two possible orientations illustrated in pink and maroon. The possible interacting residues Tyr‐127 and Thr‐128 are displayed with light blue stick representation and the catalytic residues Tyr‐156 and His‐162 are shown in dark blue 38.
