Figure 6.

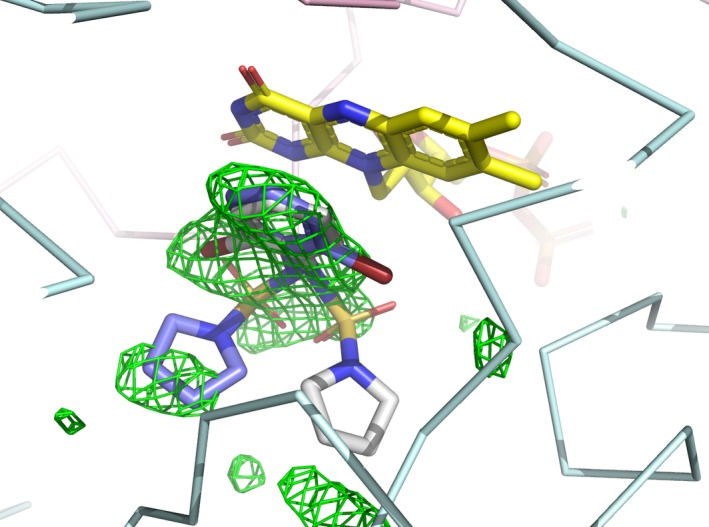
Polder map calculated for NQO1 WT. Polder map calculated in the active site of NQO1 WT and contoured at 3σ (green mesh). 39 The two binding modes of BPPSA, as well as the FAD cofactor, are shown in stick representations.

Polder map calculated for NQO1 WT. Polder map calculated in the active site of NQO1 WT and contoured at 3σ (green mesh). 39 The two binding modes of BPPSA, as well as the FAD cofactor, are shown in stick representations.