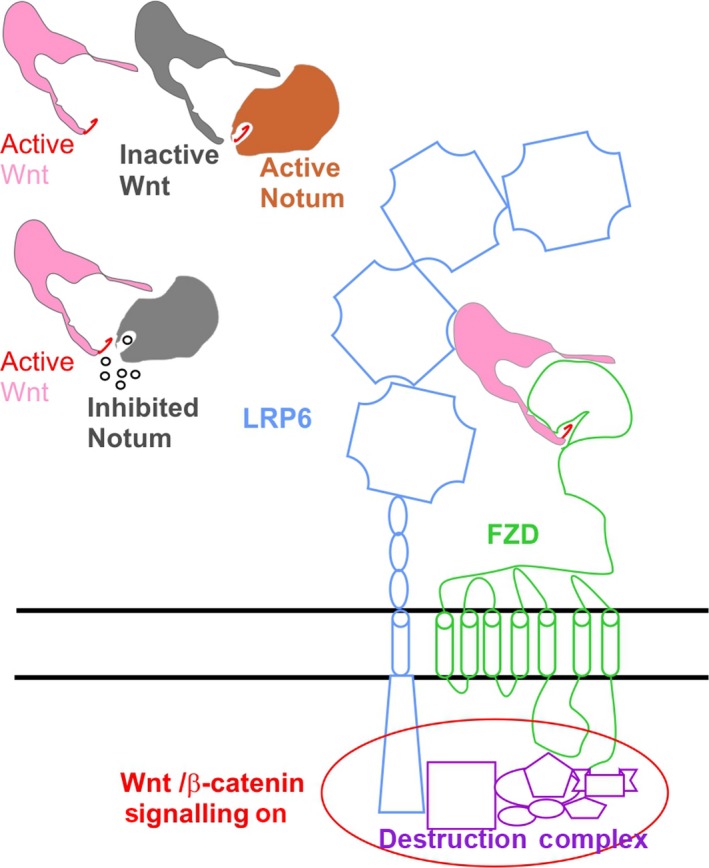
Figure 5.

Cartoon diagram showing model for Wnt signalling modulation by Notum small molecule inhibitors. The small molecule inhibitors are represented as small circles. The active Wnts are shown in pink colour with palmitoleate lipid in red and inactive Wnt in grey. The active Notum is in orange and inactive Notum in grey
