Figure 3.

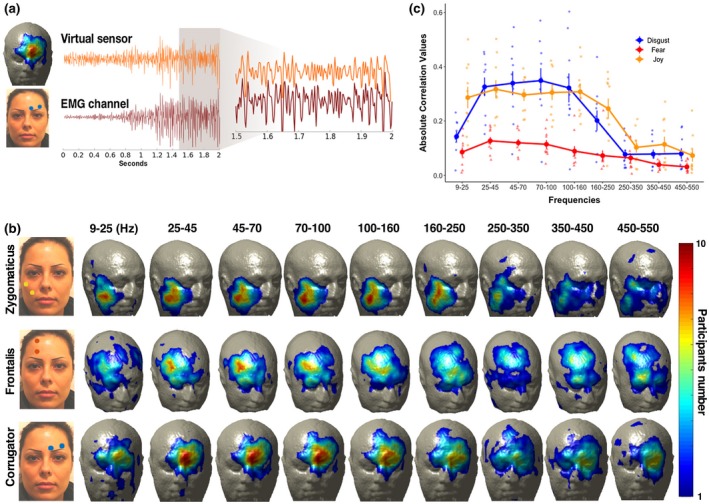
(a) Example trial hMMG versus EMG time course. The two traces represent EMG (m. corrugator supercilii) and a correspondent hMMG virtual sensor during a single contraction; magnification shows the similarity of the two traces during the time window from 1.5 to 2 s after picture presentation. MEG data have been band‐pass filtered in the 25–150 Hz range before being submitted to LCMV beamformer. (b) hMMG‐EMG localization. hMMG‐EMG absolute correlation values have been computed separately for each participant wearing EMG electrodes. The upper row shows the number of times in which a virtual sensor was among the 2.5% with the highest correlation during disgust imitation. The middle and the bottom rows show the same metric during fear and joy imitation. Correlations were computed after time series had been band‐pass filtered in nine different frequency bands. (c) hMMG‐EMG average correlation. The absolute correlation values have been averaged from virtual sensors containing the highest 2.5% absolute correlation values for the highest number of participants down to the highest number minus one, separately for each condition, after a 25–150 Hz band‐pass filtering (e.g., if maximum count in the correlation after 25–150 Hz band‐pass filtering for one condition was 9, then all the channels having 9 or 8 counts were selected). After the relevant voxels were obtained, means and standard error of the correlation per each frequency band were calculated. Dots represent single subject correlation data
