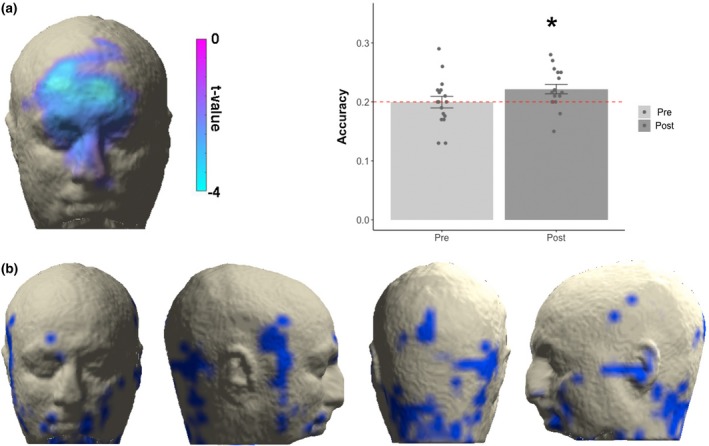
Figure 5.

(a) Valence‐contraction correlation: the only statistically significant cluster was found in the region including bilaterally the corrugator muscles but also regions higher on the z axis, a picture resembling the joy‐disgust comparisons but also including areas in proximity to the medialis pars of frontalis muscles. The lateral bar represents the values of the t test against 0 correlation. (b) Accuracy values on the whole head voxel: average classification accuracies in the prestimulus and the poststimulus period. Error bars represent standard error of the mean. Dots represent single subject accuracies for each time period. (c) Searchlight classification results: A hub of information is provided within the neck region. Only voxels showing p < .005 are represented
