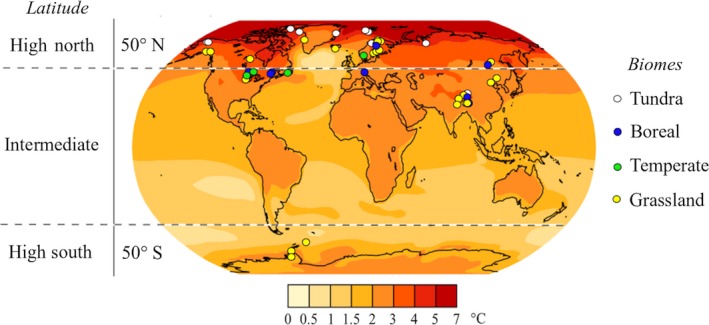
Figure 1.

Projections of global surface temperatures for 2100 (mean temperature 2080–2100 to 1980–2000, January–December AR5 CMIP subset) and locations of field studies included in this meta‐analysis (white circles). Warming projections are based on the IPCC Fifth Assessment Report Climate Change Atlas (RCP 4.5) and were generated using the Climate Explorer Tool (https://climexp.knmi.nl/plot_atlas_form.py). The location of the studies on the global map was generated using the borders function from the R package maps. The sites in Asia are over 3,000 meters above sea level. Biomes were classified based on MAT and MAP (Appendix S1: Fig. S1).
