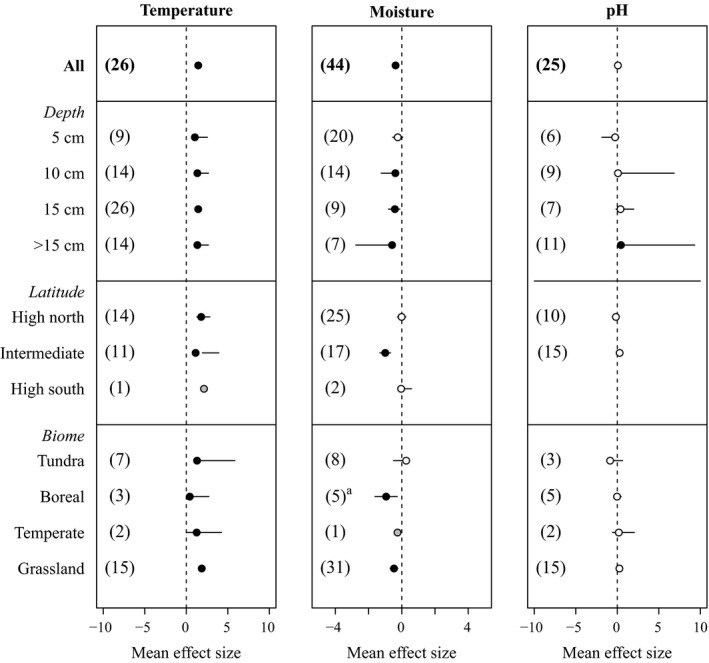
Figure 2.

Effects of experimental warming on soil temperature, moisture, and pH in cold ecosystems. Numbers in parentheses indicate the number of studies. Solid and open symbols indicate statistical significance (i.e., bars showing 95% confidence interval [CI] do not overlap with zero) and no significance, respectively. Gray symbols (without CI) are used when there is only one study. Note scale differences of x axes. aBCa bootstrapped CI: (−35.297, −0.707). For simplicity, in the figure we show the non‐bootstrapped CI (−1.615, −0.272), which also indicates statistical significance.
