
Figure 3.
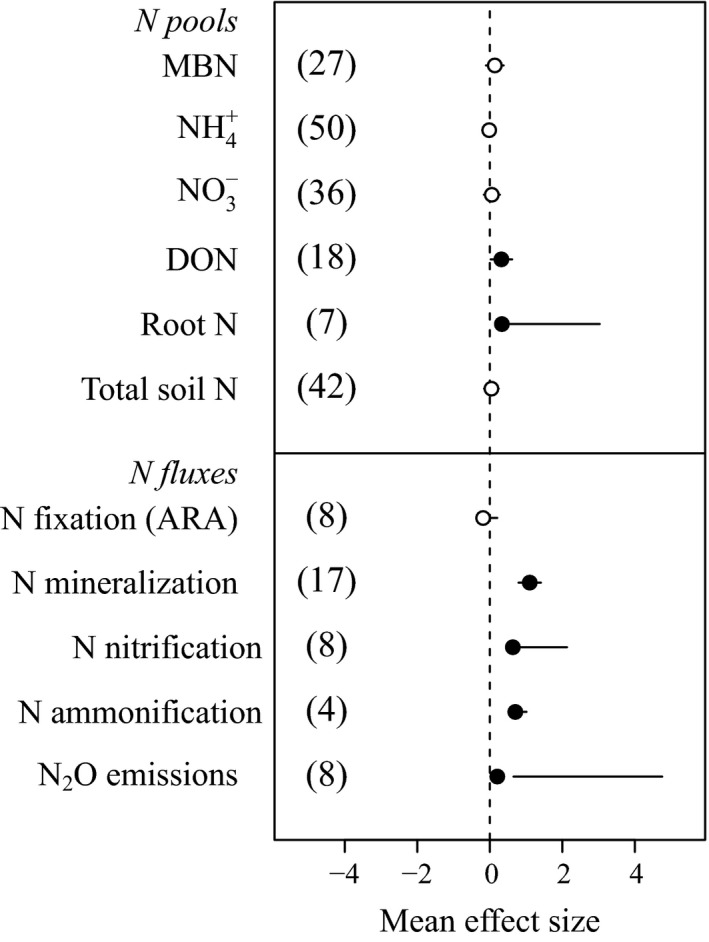
Effects of experimental warming on belowground N pools (more details in Appendix S1: Fig. S2) and fluxes (more details in Appendix S1: Fig. S3) in cold ecosystems. Root N indicates net N content, not concentration. Solid and open symbols indicate statistical significance (i.e., bars showing 95% confidence interval [CI] do not overlap with zero) and no significance, respectively.