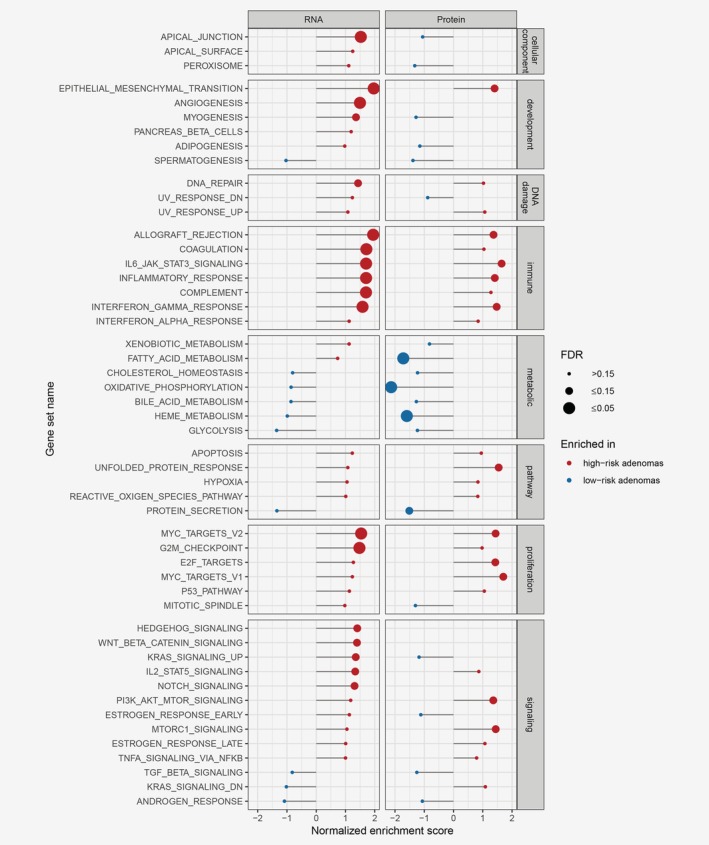
Figure 2.

Gene set enrichment analysis results in the differential analysis between HRA and LRA, on RNA and protein level, as measured by RNA‐seq and mass spectrometry proteomics. Genes or proteins were ranked based on their fold change and p‐value, with genes/proteins significantly overexpressed in HRAs on top of the list. GSEA was performed on the ranked list using hallmark gene sets. Gene sets enriched in HRAs are marked red, and gene sets enriched in LRAs are marked blue. The size of the dot reflects the significance of the enrichment (false discovery rate ≤0.15). For a subset of the signaling pathways, like Hedgehog, Wnt and Notch, GSEA on the protein level could not be determined since the number of proteins from these gene sets identified by LC–MS/MS was too small. [Color figure can be viewed at http://wileyonlinelibrary.com]
