
Figure 3.
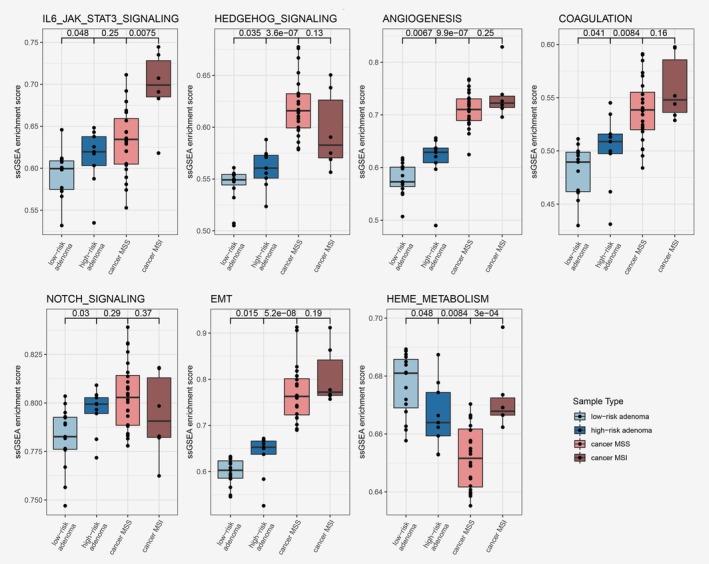
Single sample gene set enrichment scores represented per sample type; LRAs, HRAs and CRCs. Gene sets with significant differences in enrichment scores between HRA and LRA (p ≤ 0.05) were selected for this figure. [Color figure can be viewed at http://wileyonlinelibrary.com]