Figure 5.

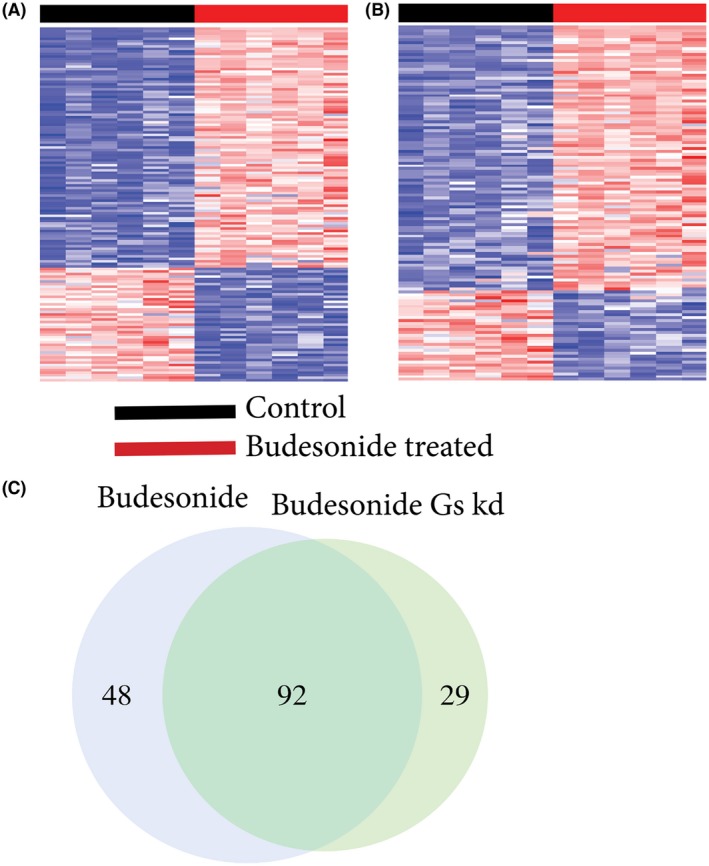
The transcriptional activity due to budesonide treatment in HASM. A, 140 gene budesonide signature representing the transcriptional activity (genomic + non‐genomic) variation between control and budesonide treated HASM. B, 121 gene budesonide Gαs knockdown signature showing the transcriptional activity (genomic only) variation between Gαs knockdown‐control and budesonide‐treated HASM. For both (A) and (B), each row represents a gene, and each column represents a sample. The red cell color represents level of overexpression and the blue cell color represents levels of low expression. Brighter the red, higher the gene expression and darker the blue, lower the expression. C, Comparison of genes from each budesonide signatures show 94 genes were shared between budesonide (out of 140 genes) and budesonide‐Gαs knockdown (out of 121 genes) signatures. 48 genes unique to budesonide signature represent Gαs dependent activity
