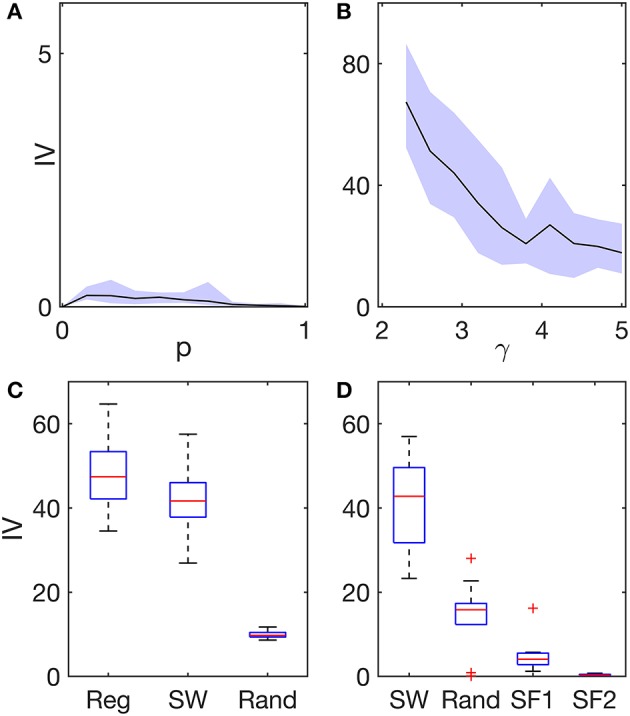
Figure 2.

Ictogenic variance (IV) in different network structures and excitability distributions. (A) IV as a function of the network re-wiring probability p (Watts-Strogatz algorithm). At p = 0 the network is regular, whereas at p = 1 the network is random. In between, 0 < p < 1, the networks are small-world. (B) IV as a function of the exponent γ (static model). The exponent γ characterizes the heterogeneity of a scale-free network with regards to node degree: lower γ corresponds to higher degree heterogeneity. In both (A,B), excitabilities across network nodes were homogeneous. Black lines represent the average IV across 10 network realizations per network topology, and the shaded areas represent the maximum variability across these network realizations. (C) IV in regular (Reg), small-world (SW, p = 0.1), and random (Rand) networks with heterogeneous excitability distributions. In these networks, a small fraction of nodes (~9%) was selected at random and defined as hyper-excitable. (D) IV in small-world, random, and scale-free networks (SF1: γ = 2.3, and SF2: γ = 5). In these networks, node excitability was defined as inversely proportional to node degree. The boxplots in (C,D) correspond to different runs over 10 network realizations per network topology. The boxes in (C) further consider five different runs per network realization using different random assignments of hyper-excitable nodes. All networks were undirected and consisted of 64 nodes and had a mean degree c = 4. See the Supplementary Material for a detailed description of how the networks were constructed and the excitability distributions implemented.
